
Weather Prediction for US between 1871 and 2005 using Digital Synthesis Environment (DSE)
Description: This on-line weather prediction system illustrates on-demand weather interpolations over time and space from measurements acquired at US weather stations integrated with a web publishing mechanism. The on-line demonstration is available at http://isda.ncsa.uiuc.edu:8080/dse/index.html.
Motivation: A scientist develops a set of algorithms to interpolate weather data, designs interpolation algorithms, processes data, and publishes a paper on the new interpolated data set. This scientist then shares the work with others by publishing a live service so that other users may execute the same or modified analyses leading to new results. Not only does the live service enable other researchers to use the interpolation, sub-setting, and visualization services, but it also makes the research results available for both knowledge integration and pursuing more complex research.
Input data sets and output visualization: We have gathered and preprocessed weather data from the United States Historical Climatology Network . The data source provides a high-quality, moderate-sized data set of daily and monthly records of basic meteorological variables. We have preprocessed the data to obtain annual averages between 1871 and 2005. Given a location (latitude & longitude) and a year, we have designed a scientific workflow that would interpolate weather variables around the year and in the proximity of the location. The data resulting from the server-side execution of the workflow is deposited into a content repository. A chosen subset of visualizations is published in a personalized web page, such as snowfall over time or a spatial map of annual temperature overlaid on top of a satellite image. The web publication allows almost instant presentation of the scientific process (the workflow) together with the "live" results on the web. A user could specify workflow outputs, a type of visualization and a placement of the visualization on a web page and then invoke the publishing service to retrieve the URL with the web page created by the described system.
Information Flow
The concept of information sharing is illustrated by describing the information flow for gathering input information, launching the interpolation of weather variables in time and space, and publishing the results on the web (see Figure 1).
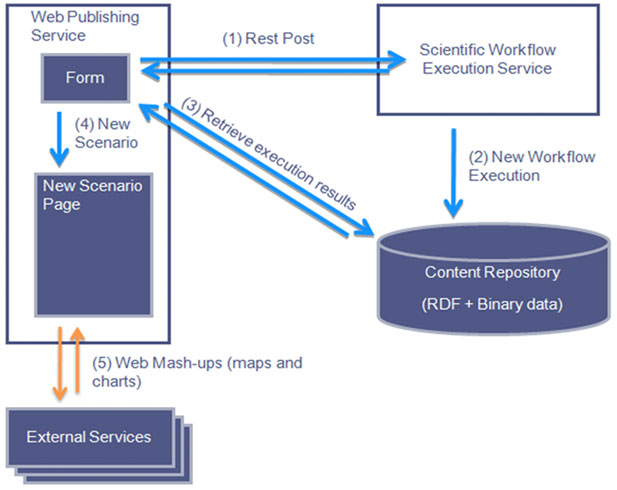
Figure 1: Information flow from form, to workflow execution to web publishing of the results in a scenario.
First, input information is gathered from an input web form. The web form shown in Figure 2 has edit boxes for entering name and date and a Google Maps interface for entering location by clicking on a map. These capabilities can also provide a public outreach component. For example, a citizen would like to visualize and understand the weather patterns surrounding his/her date and place of birth. When the user enters the relevant personal data and clicks on a Google Maps widget at the birth location, the developed system builds a personalized web page with multi-view displays of weather variables in time and space.
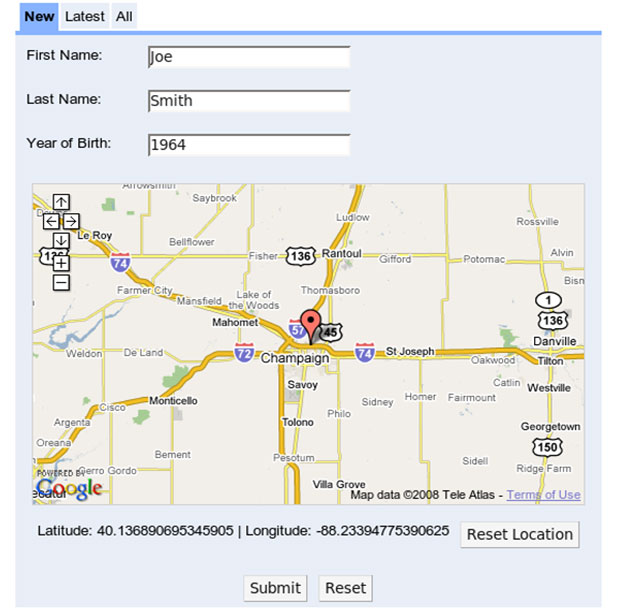
Figure 2: Input web form for entering temporal, spatial and content information (year, location and name).
After the user submits data via the web input form, a query is constructed on the client side and the weather variable interpolation is requested from a web publishing server. The web publishing server calls the workflow execution server launching the computation, and the results of the workflow are deposited into a content repository shared by the different components of the system. The web publishing server retrieves the resulting data from the content repository and generates custom visualizations based on the parameters used and the available metadata. A web page becomes available that includes the custom visualizations of the data produced, links to the raw data sets and information about the workflow, and the parameters used. External services such as Google Maps and Google Charts are used by the custom visualizations in this particular case as illustrated in Figure 3 . The custom visualizations allow users to get a better sense of the raw data and interact with such data in various ways. For example, a user can zoom and pan using Google Maps to better understand the weather map for a particular area.
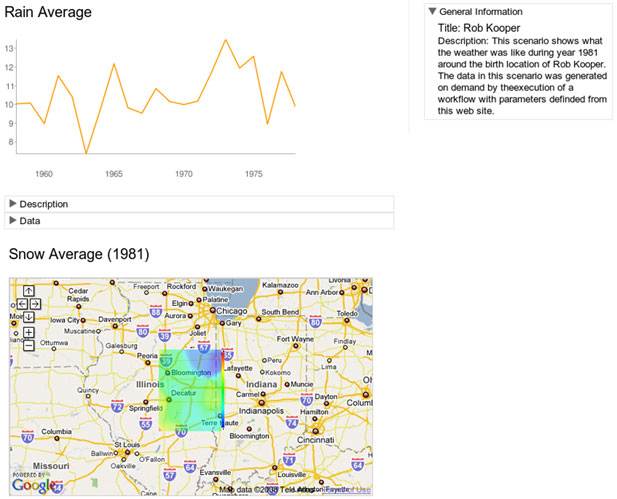
Figure 3: A personalized web page with name, time series representation of rain average variable and map representation of snow average variable.
System Architecture
The system architecture shown in Figure 4 provides an overview of the components of the framework.
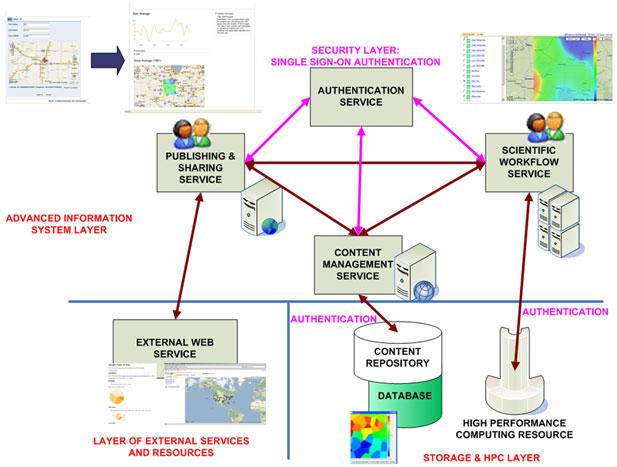
Figure 4: High level system architecture of the integration of web technologies and scientific workflows. Users would interface the functionality from a browser or from a workflow application as illustrated.
The main architectural components are (a) a scientific workflow management system, both in the form of a rich desktop client for the composition and execution of workflows on the user’s desktop and a remote execution service for the batch execution of service on remote resources; (b) a web publication service, in our case in the form of a web application accessible from a web browser whose role is to provide the users with the ability to run published workflows for a selected audience; (c) a semantic content management layer, to make it easier to write and read data and metadata in RDF format to a variety of underlying stores; and (d) a security service, such as the NCSA MyProxy software which provides X.509 Public Key Infrastructure (PKI) security credentials (certificates and private keys), to support single sign-on.
Acknowledgments
The authors would like to acknowledge the Office of Naval Research, which supports this work as part of the Technology Research, Education, and Commercialization Center (TRECC) (Research Grant N00014-04-1-0437) managed by NCSA. We would like to acknowledge the larger TRECC team at NCSA working on the Digital Synthesis Framework for Virtual Observatories for design discussions and review, middleware used in our developments, and contributions to several of the projects listed in Discussion/Use Cases.
Publication
- Marini L., R. Kooper, J. Myers and P. Bajcsy, "Towards Digital Watersheds using Dynamic Publications," In: Cyberinfrastructure special issue of Water Management, Editor: Charlie Jensen, Proceedings of the Institution of Civil Engineers, Water Management 162, Issue WM1, Pages 1-12, Thomas Telford Journals, UK, doi: 10.1680/wama.2009.162.1.1. , 2010
