CameraCalibMEMS Tools or Calibrating Spectral Cameras
With “Smart” MEMS Sensors
Overview: The primary purpose of the system is to calibrate spectral cameras using micro-electro mechanical system (MEMS) sensors or to calibrate MEMS sensors with spectral cameras. It provides software tools for programming the MEMS sensors; collecting MEMS readings, for example, temperature and luminance values; synchronizing the sensor data with other sensors as well as with the spectral cameras; and relating the MEMS spectral readings to spectral raster measurements collected synchronously with the spectral cameras. The following files contain the code implementing the above functionalities.
Main Java Classes:
In the tinyos/tools/java/net/tinyos/oscope_autosave) directory:
- SerialForward (using the serial port, this class provides a channel for communication between the sensors and the program running on the PC).
- GraphPanel (allows user interaction for data collection from the sensors. User can send a RESET signal to start the sensors, view the sensor data graphically and save the data in a desired location).
- Oscilloscope (It forwards messages between the SerialForward and the GraphPanel classes).
- SwingCapture (Responsible of capturing a continuous sequence of images from the thermal camera).
In i2k/tools:
1. ImCalculator (code to average multiple images – used to average thermal images temporally).
In i2k/tools:
1. Code to register two or more images. This is required to register the thermal and visible camera images.
TinyOS Code Files (in
tinyos/apps/PhotoTemp_Test directory):
1. OscilloscopeM.nc: Code for sensors to continuously sample the environment for light and temperature readings and transmit a data packet with 10 readings.
1. Description
The software tools have been developed for either calibrating thermal IR cameras using MEMS temperature sensors or calibrating MEMS luminance readings using hyperspectral cameras.
The procedure for
calibration of thermal IR images using MEMS sensor temperature readings can be
described as follows:
·
Program MEMS
sensors.
·
Place the
sensors in a room and focus the thermal camera to capture images of the points
where the sensors are placed.
·
Synchronize
MEMS sensors and thermal IR camera.
·
Collect
wirelessly MEMS readings over time.
·
Collect thermal
IR images over time.
·
Convert the raw
ADC values from the MEMS sensors to engineering units (ºC) using the conversion formula (given in a later section).
·
Identify MEMS
sensor locations in a corresponding thermal IR image to obtain pairs of MEMS
& thermal IR pixel values.
·
Establish the
mapping between the thermal IR pixel values and MEMS temperature values and
calibrate the entire thermal IR image.
This document is
structured as follows: We start by describing the MEMS sensors in Section 2.
This includes laying out the specifications of the MEMS sensors we worked on
and describing how to setup the sensors to collect data required for camera
calibration. Section 3 presents the thermal IR camera that we calibrate with
our tools. Section 4 describes the experimental setup to calibrate the thermal
IR camera. Section 5 gives the results of the camera calibration. Section 6
presents some general troubleshooting issues.
2. MEMS Sensors
This section describes the “smart” MEMS sensors. It gives the sensor specifications and some
details of the software suite used to program the sensors. In this document we
will use the term sensor ‘mote’ and sensor ‘node’
interchangeably. ‘Mote’ is a commonly coined term in MEMS sensor literature.
2.1 Sensor specification
In order to understand the capabilities and limitations of MEMS sensors, one needs to be familiar with the sensors specifications [1]. The sensors that we used for this study were bought from Crossbow Technology Inc. [2]. Our sensors were mounted on MTS101CA [3] sensor board (see Figure 1). The MTS101CA series sensor boards have a precision thermistor and a light/photocell sensor. A sensor board must be attached to a board, a MICA mote in our case (see Figure 2), which makes the computational power and wireless capabilities available to the sensors. The Mica board specifications are:
Ø Plug-in sensor boards like the MTS101CA, attached through a 51-pin expansion connector.
Ø TinyOS (TOS) operating system.
Ø 4MHz Atmega 128L processor.
Ø 128K bytes Flash, 4K bytes SRAM and 4K bytes of EEPROM.
Ø 916MHz radio transceiver with a maximum data rate of 40Kbits/sec.
Ø Attached AA (2) battery pack.
According to the data sheet for
the thermistor on MTS101CA [3], the raw reading
from the ADC can be converted to
degrees Kelvin with accuracy of ±0.2 Kelvin and using the following approximation over 0-50 ºC:
1/T(K) = a +
b*Ln(Rthr) + c*[Ln(Rthr)]^3
where:
Rthr =
R1(ADC_FS-ADC)/ADC
a =
0.001010024
b =
0.000242127
c =
0.000000146
R1 = 10K
ADC_FS = 1024
ADC = output value from sensor’s ADC
measurement.
Temperature in º C = (Temperature value in Kelvin) – 273
Figure 1 shows a MICA board. Figure 2 is a block diagram of the board shown in Figure 1.
Figure 1
Mica Board for MTS101CA
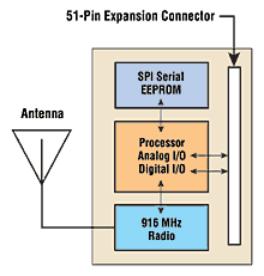
Figure 2 Block Diagram of Mica Mote
2.2 Setting up the sensors
Hardware: MICA (also
denoted as MICA 1)
Software: TinyOS version
1.0 released October 2002
This section describes how the TinyOS code is first compiled and then
installed on the sensors.
For all computers:
1. In apps/Makerules change the sensor board from
micasb to basicsb
#Sensor Board Defaults
ifeq ($(SENSORBOARD),)
ifeq ($(PLATFORM),mica)
#SENSORBOARD = micasb
SENSORBOARD = basicsb
endif
ifeq ($(PLATFORM),mica128)
SENSORBOARD = micasb
endif
ifeq ($(PLATFORM),rene2)
SENSORBOARD = basicsb
endif
ifeq ($(PLATFORM),pc)
SENSORBOARD = micasb
endif
endif
2. In tos/lib/OscopeMsg.h, perform the following change:
Add “uint16_t counter;”
Modify the entries
uint16_t sourceMoteID;
uint16_t channel;
uint8_t sourceMoteID;
uint8_t channel;
to obtain:
struct OscopeMsg
{
uint8_t sourceMoteID;
uint16_t lastSampleNumber;
uint8_t channel;
uint16_t counter;
uint16_t data[BUFFER_SIZE];
};
The entries are modified in
order to preserve the same number of bits after adding 16 bits for the counter.
For
ThinkPad Laptops
1. In the specific application
directory/Makefile, for example, Blink or any other, add the first line
HOST=THINKPAD
2. In apps/Makerules – uncomment the following line (if THINKPAD
laptop):
PROGRAMMER_EXTRA_FLAGS :=-dlpt=3
To compile the code for MICA:
On the computer configured with TOS tools, compile the TinyOS application code that you want to program your mote with. If you have successfully installed TinyOS then, assuming that apps/your_dir is the directory containing the code you want to install on the sensor motes, type:
cd apps/your_dir
make mica
To program the MICA:
In order to program a mote with an application, follow the steps given below:
1. Place the mote board (or the mote and sensor stack) into the bay on the programming board. In order to program a board, one must supply a 3-volt supply to the connector on the programming board or power the node directly. The red LED on the programming board will be on when power is supplied.
2. Plug the 32-pin connector on the programming board to the parallel port on the computer that has the TinyOS installed, using a standard DB32 parallel port cable.
3. Switch on the power supply to the mote by toggling the switch on the sensor board. After this step, the red LED on the programming board should go on.
4. Type:
make mica install
This should install the code on the mote. If you want to designate an identification number (ID) of the mote, type the ID number after ‘install’. For example, to assign ad ID of 3 to the mote, type:
make mica install.3
The number after “install.” can be any number between [0,255]. Perform this operation for all sensors to be deployed.
Program one MICA as the base station by going to apps/GenericBase and
type
Make mica
Make mica install
This mote will always be attached to the computer using the serial port.
It forwards the data from the sensors to the program on the PC (SerialForward)
and vice versa. It communicates with the sensors wirelessly and uses the serial
port to transfer data to and from the PC.
To compile the code for PC applications (e.g., oscilloscope)
Open a cygwin window
Check the classpath: It should contain the following path
C:\jdk1.3.1_01\bin;C:\jdk1.3.1_01\lib\comm.jar;C:\jdk1.3.1_01\lib\javax.comm.properties;C:\tinyos-1.x\tools\java;.;
C:\tinyos-1.x\tools;
Type:
cd tinyos-1.x /tools/java
make
Note: this should
compile all directories recursively under java directory.
To run the application:
Open two cygwin windows:
On cygwin window 1, type:
cd tinyos-1.x /tools/java
java net/tinyos/sf/SerialForward
This should bring up a window similar to the one shown Figure 3.
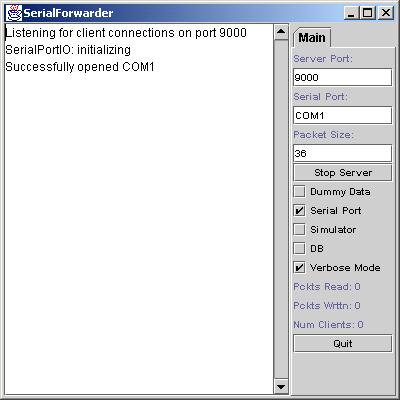
Figure 3. Snapshot
of the Serial Forward window
On cygwin window 2, type:
cd tinyos-1.x /tools/java
java
net/tinyos/oscope_autosend/oscilloscope 125
Note: 125 is the group
ID of a cluster of MICA sensors. It is 125 by default and it can be changed
when MICA is programmed.
Make sure that the SerialForward launched from the first cygwin window is
up and running before the Oscilloscope application is run. Figure 4 shows a snapshot of the Oscilloscope window that is
displayed when the Oscilloscope application is launched.
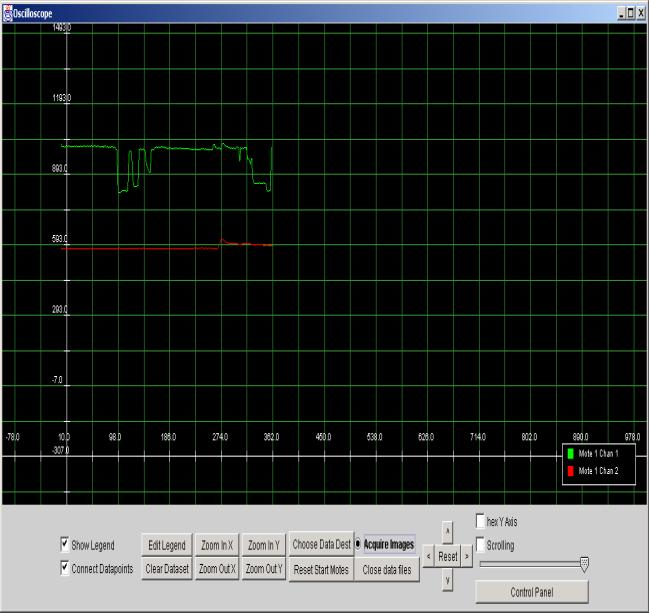
Figure
4 Snapshot of the Oscilloscope
window
Functionalities on the
Oscilloscope window:
The oscilloscope application that came with the TinyOS installation has been modified. The modified version stores the data automatically as it is streaming in through the base station. The data is stored in a directory (that can be specified through the ‘Choose Data Dest’ option), with one file per sensor mote. To create unique filenames, the current system time is appended to the default name and the mote’s ID is added to the end, to distinguish files containing data from different motes.
1. ‘Show Legend’: this radio button when enabled, displays the data legend alongside the plotted data points.
- ‘Connect Datapoints’: this radio button when enabled, connects the data points that are plotted on the graph.
- ‘Edit Legend’: Allows user to edit the data legend.
- ‘Clear Dataset’: Clears the previous data and starts plotting data afresh.
- ‘Zoom In X’: zooms in the X axis.
- ‘Zoom Out X’: zooms out the X axis.
- ‘Zoom In Y’: zooms in the Y axis.
- ‘Zoom Out Y’: zooms out the Y axis.
- ‘Choose Data Dest’: Allows the user to specify the destination directory where the files containing the collected data will be stored. This MUST be specified before the sensors data starts streaming in. If the destination directory is not specified, the current directory is used to store the sensor and camera data.
- ‘Acquire Images’: This radio button should be selected if one wants to acquire camera images simultaneously with the sensor data. This MUST be selected before ‘Reset Start Motes’ is clicked.
- ‘Reset Start Motes’: in order to synchronize data collection, the motes wait for a RESET signal from the base station. This button when clicked causes the base station to broadcast a RESET signal, after which the motes start sending a continuous stream of data to the base station.
- ‘Close data files’: To stop the application, one MUST first switch off the base station. Then, click the ‘Close data files’ button. This closes all the output files where the data was being saved during data collection. If ‘Close data files’ is not clicked, the files will not be properly saved.
3. Thermal Camera
We are calibrating an Omega thermal IR camera. It is a long-wavelength (7.5-13.5 microns) uncooled microbolometer camera designed for infrared applications and manufactured by Indigo Systems Corporation, Goleta, CA. It is controlled via RS232 serial port and the analog NTSC video output is digitized using a Hauppauge WinTV board. We used the Java Media Framework (JMF) to control acquiring images, from the thermal IR camera through the Hauppauge WinTV board, from within the oscilloscope code. In order to synchronize the camera with the sensor data collection, we start a thread that does image acquisition as soon as the RESET signal is sent to the sensors. Starting image acquisition at the same time as the sensors are started ensures that the sensors and the camera are synchronized. Just before saving the images, the thread timestamps each image with the time that has elapsed since the thread’s start time. A time-stamped image can later be correlated with a time-stamped sensor reading.
4. Experimental Setup
Figure 5 depicts our experimental setup. Eight sensors are arranged in a grid and sample the environment continuously for temperature and luminance readings. One sensor is attached to a PC and collects data from the sensors and forwards the data (through the SerialForward application) to the PC to be stored for analysis later.
Figure
5. Experimental Setup
Figure 6 shows a temporarily averaged thermal camera image. The reason for averaging the thermal images was to reduce the RGB pixel noise that exists in the acquired images.
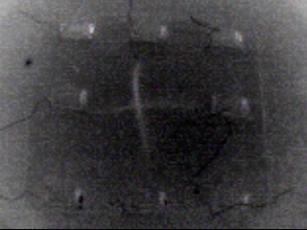
Figure
6 Temporally
averaged thermal IR image
To calibrate the thermal IR camera we wanted to locate the temperature sensor (thermistor) on each MICA mote in the thermal images. Looking at the thermal image in Figure 6, we cannot spot the thermistors clearly. Thus to determine the exact location of the thermistor, we registered the thermal camera image with an image acquired from a visible spectrum camera. We took an image of the same experimental setup using a visible camera. Figure 7 shows the image captured by the visible spectral camera. A close look at Figure 7 shows a tiny black spot on each mote. This is the thermistor whose thermal image’s pixel value we are interested in. By registering a thermal image with the spectral image, we were able to pinpoint the exact location of the thermistor in the thermal image, and thus determine its pixel value in the thermal image.
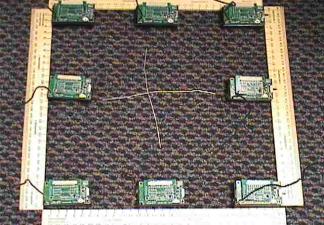
Figure 7 Experimental setup viewed through a visible camera. The tiny black spot in the middle (slightly towards the right) of a sensor mote is the thermistor, whose thermal IR pixel value we need to determine.
A thermometer with an accuracy of ± 1°C was also used to verify (and calibrate) temperatures during the experiment obtained using the manufacturer’s formula provided in Section 2.1. For the calibration experiment we kept the laboratory temperature constant at 21 °C (measured by the thermometer). The temperature close to the thermistor on each sensor was also recorded using the thermometer. The thermometer indicated the same temperature of 21 °C for all the sensors.
5. Calibration Results
Once we have collected the data from the MEMS sensors and the thermal IR
camera, we can analyze them together using I2K software tools. For increased
reliability, we averaged multiple thermal IR images and MEMS sensor readings.
These averaged images/readings are then used computing the calibration
parameters of a selected model.
Figure 8 shows the outcome of the thermal IR camera
calibration using the hot-cold pseudo-color visualization scheme. The blue
color depicts the coolest regions (pixel value close to 15 corresponds to about
17ºC) while red the hottest
(pixel values around 180 corresponds to about 26ºC). This image complies with our intuition.
The red area is a metallic switch that is hotter than any other object in the
thermal camera’s field of view. With our calibration mechanism, we can assign
temperature values to all the different colored regions in the image in Figure 8.
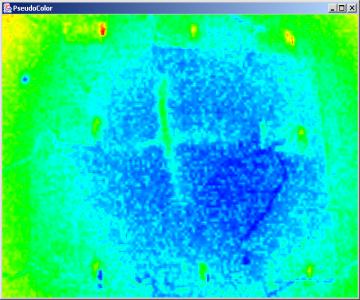
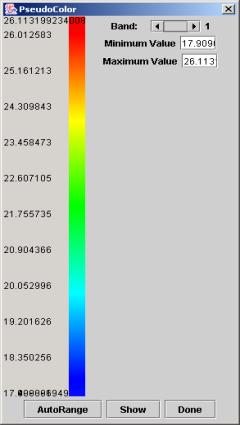
Figure
8 Pseudo-colored
thermal IR image
6.
Troubleshooting
This section addresses some common issues that one may face while working with the MICA motes.
Ø
Generating documents for debugging
A useful feature in TinyOS is that it allows you to generate documentation on the fly, during code compilation. The document thus generated gives a pictorial representation of how the different components used by the code are wired to each other. This can be very helpful during debugging as it allows the programmer to ensure that the components are linked as intended by the programmer. One can generate the document for a code by typing: “make docs mica” for compiling the code instead of typing “make mica”.
Ø
Motes programmed without errors, but not giving
the desired output?
Before you do anything else, make sure you know your sensors and Mica board well (http://webs.cs.berkeley.edu/tos/tinyos-1.x/doc/micasbl.pdf) and have checked some of the files that are used during installation of your program on the motes. One such file is the Makerules file in the tinyos-1.x/apps directory. By default, when we say ‘make mica install’ while programming our motes, Makerules file assumes that the mica board is of type ‘micasb’. However, as we found out later, after a few weeks of futile effort at programming our motes to give the right output, our motes were of type ‘basicsb’. To get the right output, we then changed the following Makerules file’s lines:
#Sensor Board Defaults
ifeq ($(SENSORBOARD),)
ifeq ($(PLATFORM),mica)
# SENSORBOARD = micasb …comment this out
SENSORBOARD
= basicsb …add
this line
endif
If you are sure that the problem is not in your code, and that all the components are wired well in your code’s configuration file, then you should check the other ancillary tinyos files to ensure that the right settings are being used. Directory contents of ‘C:\tinyos-1.x\tos\sensorboards’ give the detailed pin layout of different Mica boards and comparing them with your own board will help to determine your board.
Ø Sometimes one can’t obtain data from the ADC component on the motes.
ADC component can handle only one request at a time. So, if you call ADC.getData() successively, before the first call has been fulfilled (through the signaling of the ADC.dataReady() event), the second call will fail.