Viewing Images in 2D:
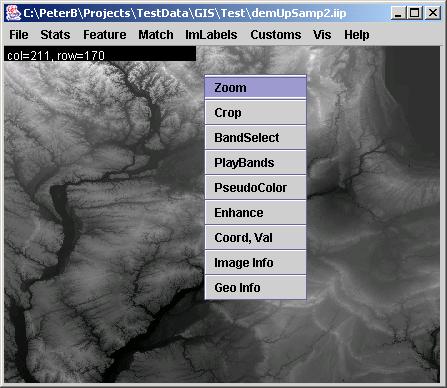
Images are displayed in an image frame. Basic image information and visualization can be obtained by a right mouse click followed by a selection from a pop-up menu. The pop-up menu allows a user to choose from “Zoom”,“Crop”, “BandSelect”, “PlayBands”,“PseudoColor“,“Enhance“, “Coord, Val”, “Image Info” and “Geo Info” options.
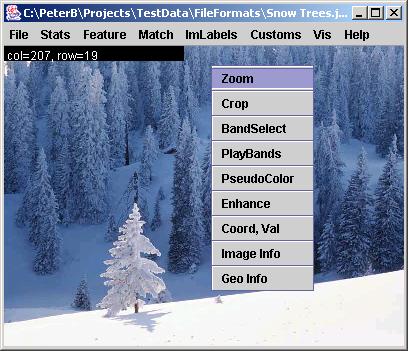
Image Visualization:
The six choices, “Zoom”, “Crop”,“BandSelect”, “PlayBands”,“PseudoColor“, and “Enhance”, are intended for visualization by either viewing a still full size or cropped image with one or three bands (grayscale or color) at multiple zoom levels, or by playing all bands as a movie, or enhancing the color distribution. The “Zoom” dialog provides a means for zooming images from the option list of 25%, 33%, 50%, 100%, 200%, 300% and 400% of the original size with or without preserving an image aspect ratio. The cropped image subregion is set under “Crop” option by clicking and dragging a mouse and modifying the subregion choice in the displayed SubArea dialog. The “BandSelect” dialog enables the selection of bands from multi-band images that will be viewed. The “PlayBands” dialog allows a user to choose whether to play bands of a loaded multi-band image or to present images from a file system in a time sequential order. The need for playing images from a file system arises when multi-band images exceed in size the available memory (RAM). The speed of playing bands or images can also be set in “PlayBands” dialog. The Enhance and PseudoColor options come handy when images have very low contrast (dynamic range of values) or a specific range of intensity values should be inspected.
|
|
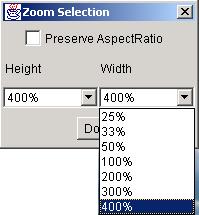
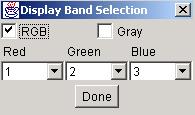
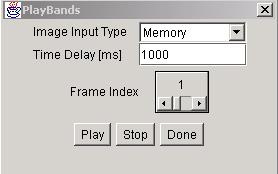
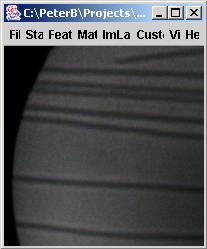
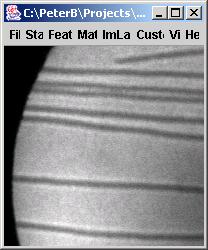
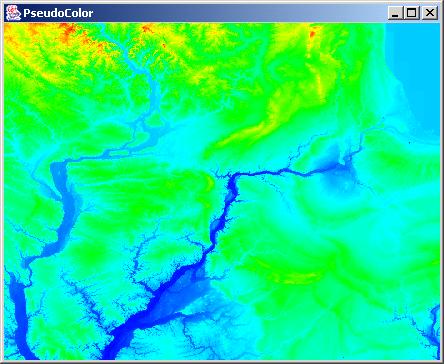
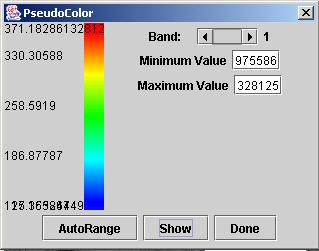
Image Information:
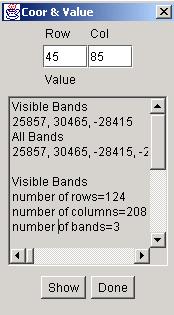
The other two choices, “Coord, Val” and “Image Info”, provide information about coordinates, values and overall image parameters. After selecting “Coord, Val”, a dialog will pop up with the row and column information at the location of a mouse click. The image values associated with the coordinates are shown for the image shown in the frame (denoted as visible bands) and for the image loaded into a memory (RAM). It is possible to view the values of a 3x3 neighborhood around the row and column location by clicking the “Show” button. If a new location should be explored then a new set of coordinates can be entered into the row and column edit boxes. The row and column information only can also be viewed in the left upper corner of the image frame every time a left mouse click is followed by a mouse drag operation.
|
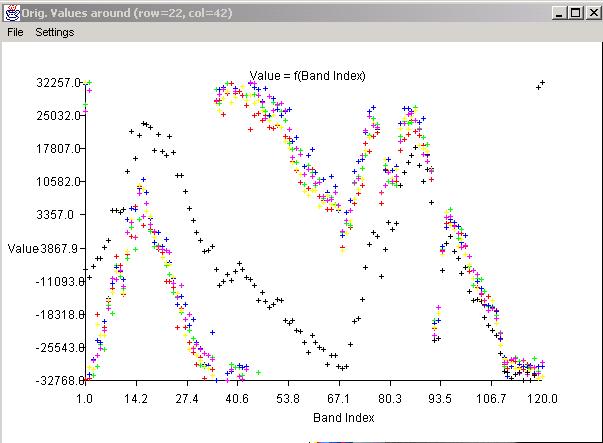
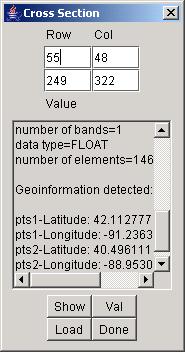
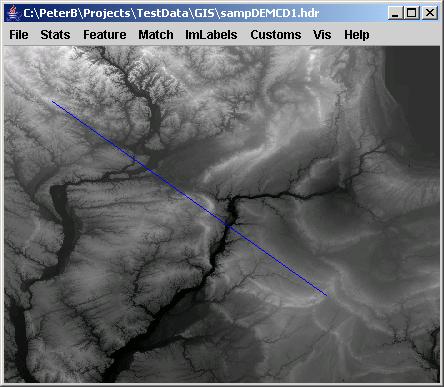
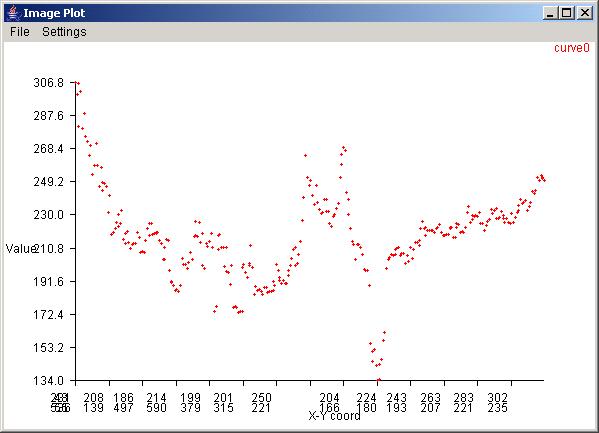
It is possible to obtain a obtain a cross section of the displayed image by a right mouse click followed by a mouse drag operation and CoordVal Dialog instantiation. In this case, one would see a similar CoordVal Dialog with editable coordinates of two end points of a line (shown as in blue in the main frame). If the image contains georeferencing information then the two points would be reported in a row/column coordinate system, as well as in a latitude/longitude coordinate system. The values of a cross section along a selected line can be visualized (a) by clicking on the Val button in a form of a plot or (b) by clicking on the Show button in a form of an image with the number of columns equal to the number pixels along the cross section and the number of rows equal to the number of bands.
|
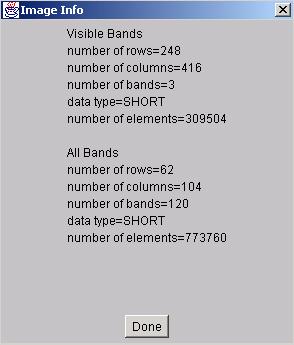
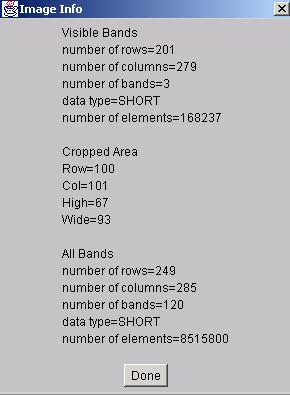
The overall image information can be obtained by selecting “Image Info” from the pop-up menu. The image information contains number of rows, number of columns, number of bands, data type and number of image elements. If the image was cropped then there is also information about the cropped subregion.
|
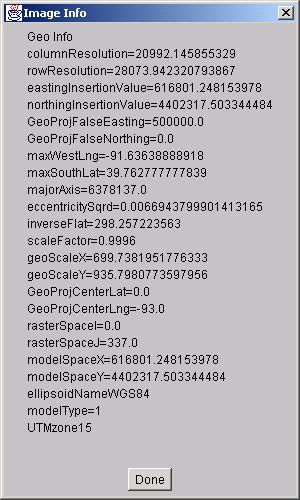
Georeferencing Image Information:
The last choice,“Geo Info”, provide information about geographcal image parameters. The georeferencing information can be obtained by selecting “Geo Info” from the pop-up menu. The georefencing information contains projection type, physical pixel resolution, insertion point, scale factors and so on. An example is shown below.
|