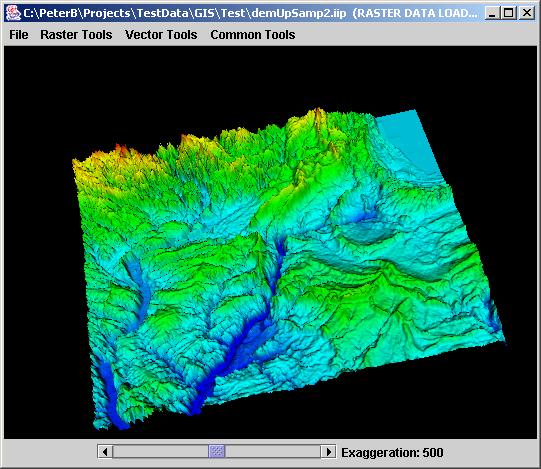
Viewing Images in 3D:
We have also developed 3D visualization
support for specific applications. 3D visualization tools are designed for
raster (image) data, volume data and temporally changing point measurements.
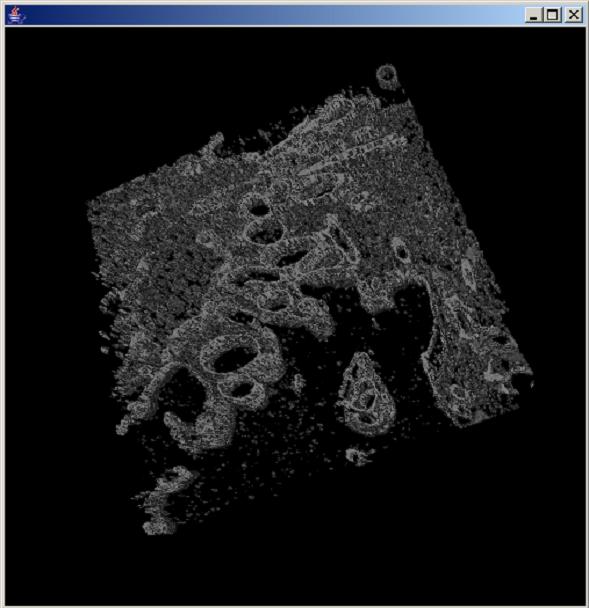
Multi-band raster (image) data can be viewed in 3D by displaying one band
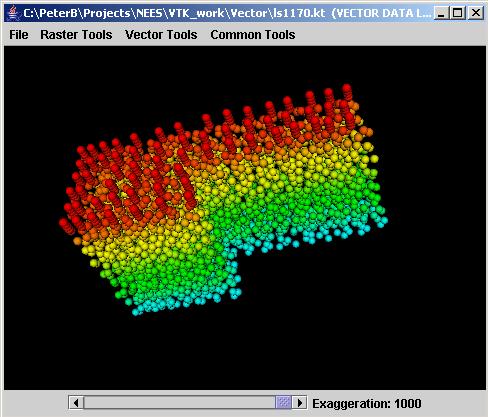
at any time t or many bands next to eachother at once. Temporally changing
3D point measurements can be shown as a cloud of 3D points at any time t,
or as 3D temporal animations, or as 3D visualization of 3D visualization of
all time steps of 2D displacement (View XYT option in the Vector Tools menu).