The class GeoFeatureHistDialog provides a tool for computing a histogram of forest labels for geographical regions computed from
raster-based information about a geographical area, for example, raster-based information about location of different forest labels.
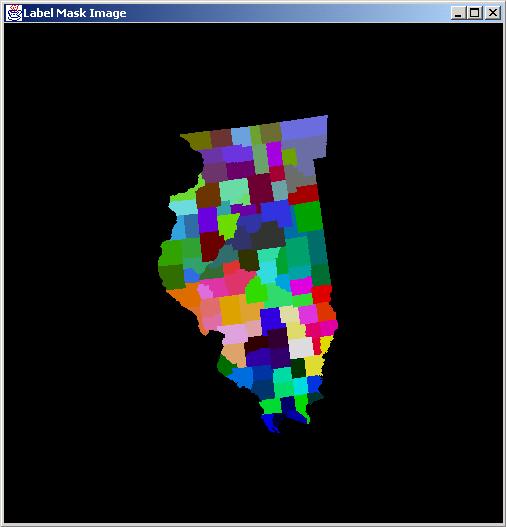
The tool fuses raster (e.g., forest labels distribution) and vector (e.g., county boundaries) data using georeferencing
information, displays overlaid data, computes the histogram of forest labels over each boundary and reports results in a DBF file, as well as
in a visual form.
Description:
The tool is designed to calculate the histogram of raster-based geographical features per each geographical boundary.
Raster-based features are represented as an image
with multiple bands and geographical boundaries are represented as vectors of points
loaded from the ESRI shape file. It is assumed that raster and vector data are also described with
georeferencing information so that the two data sets can be fused.
Setup:
Once raster information was loaded into the main window, region boundaries should be loaded from an ESRI shape file by clicking
on "LoadShape".
The loaded shape file can have its points specified either in pixels or in latitude/longitude. If the shape file points are described in terms of latitude/longitude,
then the user MUST select the option to convert the latitude/longitude to pixels. If such a conversion is required,
the underlying image MUST have geo-specific information to allow this conversion of shape file points.
For instance, if the underlying image is a digital elevation map (or DEM image),
its associated header file may contain information like the UTM Northing and Easting insertion values and the column and row resolution.
Using these geo-specific values, standard georeferencing conversions (defined in GeoConvert class) are applied to convert points from latitude/longitude co-ordinate system
to pixel co-ordinate system.
The loaded boundaries can be viewed by clicking on the button "ShowShape". If one would like to view the centroid points
of all boundaries then the button "Show Centroid Points" will overlay centroid points on the image. Before showing the overlay of boundaries
on top of the image (raster-based information), the two data sets (boundary points and image pixels)
are georegistered based on their georeferencing information.
Georegistration involves conversion of boundary points in latitude/longitude to boundary points in pixel coordinates and is performed
automatically when either of "ShowShape" button or "Compute" button is initiated. This conversion is performed only once because
the computation is very expensive.
Since a shape file could have many points that do not even fall on the image, it is wasteful to convert all shape points to pixels.
One of the optimizations done during this conversion process is to convert only those points that actually lie on the underlying image.
The algorithm works by first checking which boundaries of the shapes defined in the shape file,
overlap or lie entirely within the underlying image's boundary. Only for those particular boundaries, the
points are converted from latitude/longitude value to x/y pixel value.
A new shape object with a new set of relevant points is constructed using this procedure.
After this optimization, all other methods in this tool work only on the reduced set of shape points.
This gives considerable speedup.
Inputs required to run the tool:
The following inputs are required to run the tool:
1. The forest labels image file on which the shape file will be overlaid. There MUST also be a corresponding '.txt' file
(i.e a file with the same name, but suffixed with '.txt' extension) that should contain the RGB values of the different
labels that the main image file displays. If there is no '.txt' file then the tool CANNOT be launched. Furthermore, since
there was no technical specification about how the RGB values for the labels will be present in the '.txt' file, the tool was developed
based on the observation from the data files we had. It searches for the term 'RGB values' in the '.txt' file and then assumes that
the following lines contain the labels' RGB descriptions. This is the format in which the tool expects to find the RGB values for labels
in the '.txt' file:
>Value Class name RGB values
>----------------------------------------------------------------
>0 ocean fill 132 193 255
>1 non-U.S. land 204 204 204
NOTE: The key terms the tool looks for, while extracting RGB information are:
(i) 'RGB values' : To mark the beginning of the RGB values.
If the '.txt' file has more than one occurence of the term 'RGB values', the tool will fail.
(ii) '>' : at the beginning of each line describing a label's RGB value.
(iii) Label-number
(iv) Label-name with atmost 1 space between individual words, if the label is made of more than 1 word.
(v) The actual R, G, and B values, seperated by spaces.
2. The shape file which needs to be overlaid on the image loaded in the previous step.
If the shape file points are described in latitude/longitude, the underlying image must have geo-specific information
to allow conversion of shape points from latitide/longitude to pixel. To indicate that this conversion is required, the
'Enable lat/lng to pixel conversion' radio button must be selected.


Step 1: An image must be loaded in the main image window. This is the image on which the user wants overlay a shape on that image and perform various computation.
Step 2: Click 'Load Shape'. At this time the user must decide whether to enable or disable the 'lat/lng to pixel conversion' option,
as it will affect all future computations on the loaded shape.
Step 3:One can click 'Show Shape' to view the loaded shape overlaid on the underlying image. If there is no overlap between the loaded shape
and the image, then a 'No overlay found' message is displayed to the user.
Step 4:If an overlap was found in Step 3, the user can click 'Compute' to initiate computing the histograms mentioned earlier.
Step 5:Using the combo-box 'Select Feature', the user can then select the label whose concentration he wants to view.
'Show Results' can then be clicked to get a gary-scaled image for the the selected label.