Description: The GridLineFeatDialog class incorporates GUI for grid alignment (GridLine class), grid screening and feature extraction (GridFeatures class) and feature clustering (Isodata class). The overall system design is illustrated in the figure below.
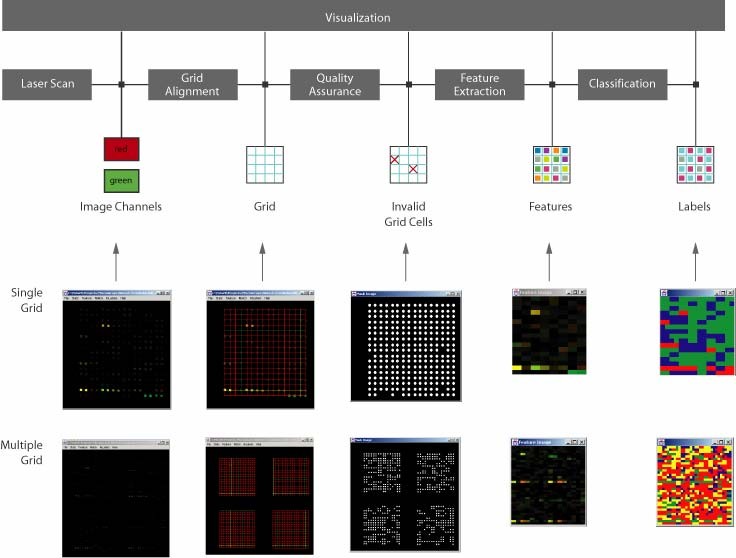
The class GridLineFeatDialog was built as a user friendly interface for microarray image processing and inspection tasks. A user can go through a microarray inspection process by changing tabbed dialog interface and executing individual steps of microarray processing.
Setup: The parameters for running the grid alignment tool are described in GridLine class and the parameters for running the screening and feature extraction tools are documented in GridFeatures class. While grid alignment, screening and feature extraction are performed per each grid, multiple grids in one microarray image are handled by GridLineFeatDialog class and the variables N2FindGridRow (the number of expected grids along row axis) and N2FindGridCol (the number of expected grids along column axis) are stored in GridLineFeatDialog. Among the four tools, the clustering (classification) tool has not been described and the description is provided next.
The interface to feature clustering is shown below.
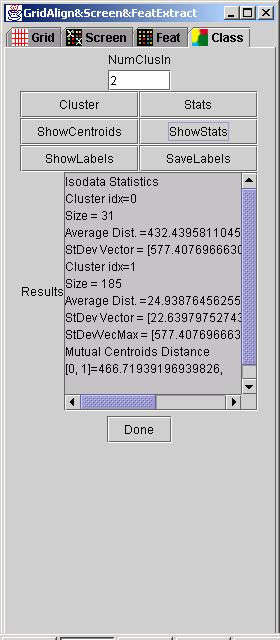
The feature clustering algorithm is described in Isodata tool. The only input parameter is the number of expected clusters (NumClusIn).
Run: Since grid alignment, screening and feature extraction tools have been described in GridLine and GridFeatures, we explain only buttons in the GridLineFeatDialog under Class tab. After NumClusIn was set, a user clicks on button "Cluster" to execute the random seed initialization and Isodata clustering. Statistics of already found clusters can be computed by clicking "Stats" button.
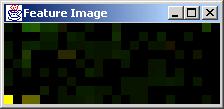
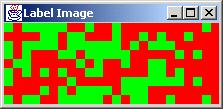
Results: Results of the clustering can be displayed in the text area labeled as Results by clicking "ShowCentroids" or by clicking "ShowLabels" and viewing a label image. The label image assigns each cluster one color in a red-green-blue color space. Similarly, statistics of each cluster can be viewed in the text area by clicking "ShowStats". The button "SaveLabels" allows the user to save the label image into a file. An examples of a feature image and the corresponding label image are shown below.