Class ImageCompareDialog
Description: The class ImageCompareDialog provides a graphics user interface (GUI)
to the class ImageCompare designed for comparing two images for similarity.
Even though to the human eye two images look the same there can be some minute differences,
this dialog will allow the user to select a comparison method to compare two images and
visualize the minute differences between the images. The tool will allow the user to load
a test image, a mask (or use a predefined mask) and test method, as well as a multiplier
for the result image and the type of the result image.
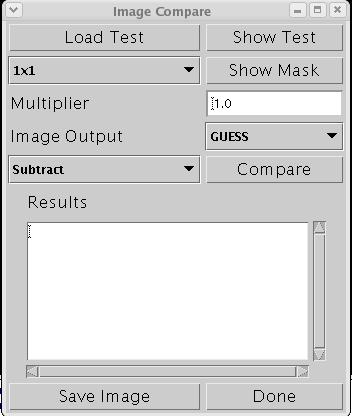
The dialog shows all these options. To perform a comparison the user must first select an
image to compare the current image in the mainfram against using the "Load Test" button.
This will show a dialog allowing the user to load an image. To make sure the right image
is loaded the user can show the test image using the "Show Test" button.
Next the user has to decide which mask to use. The user can use one of the predefined masks
or load a custom mask. The predefined mask will create a mask image that splits the original
image in squares of the selected size, from 1x1 (pixel) to 100x100 size squares. If the user
selected "Load Mask" a dialog will appear allowing the user to load an image to be used as a
mask. Only the first band of this mask image wil be used! The user can check the mask by
clicking on the "Show Mask" button. Some masks however don't work well with certain
comparison methods (for instance pixel (or 1x1) does not work with histogram test.
Next the user has to select which test to use. The user can choose one of the following test:
- Subtract
- For each region and band, as defined by the mask, this routine will calculate the
average for both the original and the test and subtract them from each other. The result
image will contain the difference in that region. Setting the mask to 1x1 will result in
the difference per pixel for the image and test image.
- Correlation
- This will calculate the Pearson linnear correlation for each band and mask value.
Currently only the pearon value is calculated correctly. If the mask is set to pixel ((1x1)
it will compute the correlation per band over the whole image. There is no resulting image.
- Histogram
- For each band and region in the mask image, we create a histogram of all values. After
normalization we calculate the percentage of pixels that are placed in one bin, but should be
in another. The resulting image will have this percentage.
- Chi Square RGB and Chi Square HSV
- This will compute the CHI-Square value on a per band and mask region. The resulting
CHI-Square value will be returned in the result image. We have observed that for images with
small changes (i.e. a red scratch in the image) the CHI-Square value will be large enough
to result in a probability of 0.
- Tuple
- This will create a subimage by taking the 3 highest bits of the first, second and the
2 highest bits of the third band and combine them into a 8 bit byte. Next it performs a
CHI-Square test for each mask region and band on this subimage and the subimage created
from the testimage in simmilar way. The result image will contain the CHI-Square value for
each mask region.
- Long Chi Square RGB
- This is the same as Tuple except that instead of only using a few bits we concatenate
the first, second and third byte of both images and perform a CHI-Square test on each of
these new images. The resulting CHI-Square value will be put in the resulting image.
Finally the user can use the Multiplier and Image Output fields to select what imagetype
the resulting image will be and what multiplier needs to be used when comparing the images.
For instance to create an BYTE image of the Histogram we need a multiplier of 255 since the
original range of values will be between 0 and 1.
The user can save the result of the comparison as an image using the "Save Image" button.
Author:
Rob Kooper