Description: The GridLine algorithm is data driven and its goal is to find a set of mutually perpendicular lines that intersect at a center of each grid cell. A grid cell is defined as an area enclosing one dot and is a part of a 2D array of dots. From a processing standpoint, the algorithm assumes that lines intersect a large number of high contrast and low contrast areas in contrary to the background that is assumed to be homogeneous in color with superimposed additive noise. In addition, line directions are not constrained and therefore any translated and rotated 2D array of dots can be detected. Furthermore, multiple distinct 2D arrays (grids) can be found as well by partitioning an input image into subimages and aligning each distinct grid separately. If speed is an important issue then it is addressed by downsampling input images and running the GridLine algorithm on a smaller sized image.
Setup: The basic set of parameters for running the GridLine algorithm consists of the following input variables:
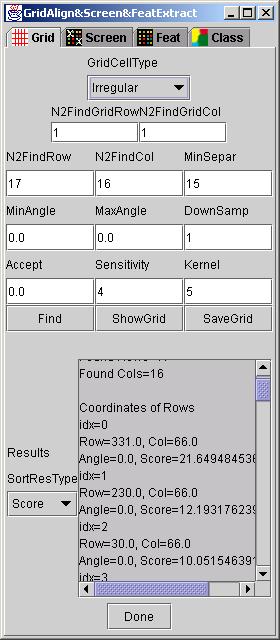
N2FindRow is the number of expected rows in each grid.
N2FindCol is the number of expected columns in each grid.
MinSepar is the minimum separation of grid lines.
MinAngle and MaxAngle defines the range of acceptable grid rotations in degrees.
DownSamp represents the down-sampling ratio if it is desirable to reduce computational requirements.
Accept is the minimum acceptance value from the range [0,100] for reporting \ a valid grid line.
Sensitivity is the threshold value for separating background noise from signal.
Kernel is related to the expected size of areas that represent high contrast transitions. This parameter is used for filtering images and extracting grid line features.
These input parameters can be set in the GridLineFeatDialog under tab dialog "Grid"(see below).
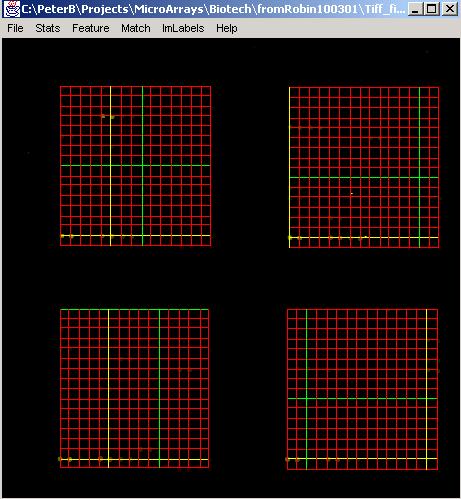
Furthermore, it is possible to search for multiple distinct 2D arrays of dots (grids) in one images which is the case of DNA microarray image analysis. In the microarray images, these distinct grids are also arranged in a 2D array format hence the number of expected distinct grids is defined by the number of grids along horizontal (row) and vertical (column) axes. The corresponding labels in the GridLineFeatDialog are:
N2FindGridRow is the number of expected grids along row axis.
N2FindGridCol is the number of expected grids along column axis.
The search for mutually perpendicular lines can accommodate additional requirements imposed on a searched grid, such as, regular spacing between adjacent rows or columns or both rows and columns. These requirements can be enforced via the GridCellType choice option in the GridLineDialog.
If the speed of the algorithm is a major concern then the values of DownSamp should be modified. This value provide a means for trading the accuracy of the results with the speed of computation.
It is possible to enable automatic selection of the Sensitivity parameter by setting the value to any integer larger than 128. The algorithm will optimize the Sensitivity value based on a global variation of intensities.
Run: After all the input parameters were set according to their description, a user clicks on button "Find" to execute the search. The status of the execution is displayed in in the text area labeled as Results.
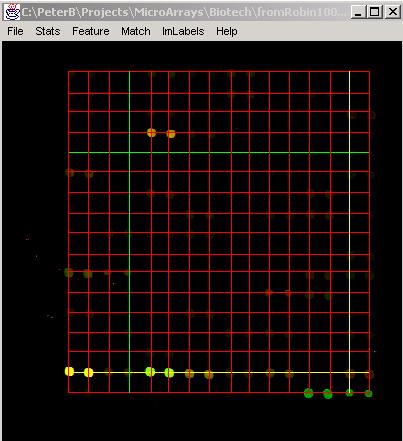
Results: Results of the search can be displayed in the text area labeled as Results by clicking "ShowGrid". Furthermore, the resulting grid will be overlaid on the original image with a red color denoting grid lines. The horizontal and vertical lines that were obtained with the highest score are drawn yellow and with the lowest score are drawn green. The button "SaveGrid" allows the user to save the grid results into a file. Examples of the resulting grids overlaid on the original 2-band images are shown below after searching one grid or multiple grids.