Description: The Isodata algorithm computes (NumClusIn +/- NumClusDelta) clusters. The clusters are created by iterative assignments of n-dimensional points. The assignment is based on the minimum Euclidean distance of a point from all current cluster centroids. After each iteration, the cluster centroids are updated to the centroid of all currently assigned points. The initial set of centroids called seeds are obtained prior to the clustering run.
The following input parameters are present in the IsodataDialog:
NumClusIn is the number of desired clusters.
StDev is the standard deviation threshold for splitting a cluster.
MaxIterations is the maximum number of iterations before the algorithm is terminated.
MinSampPerCluster is the minimum number of samples per cluster in order to consider the cluster to be valid. If a cluster contains fewer than MinSampPerCluster points then it will be discarded and the points will be reassigned.
Lump is the minimum Euclidean distance between two valid clusters. If the distance is smaller than Lump then the cluster will be merged.
MoveCentroidsThresh is the threshold value for terminating the algorithm. If none of the cluster centroids has moved by more than MoveCentroidsThresh then the algorithm is terminated.
SubSampRow and SubSampCol are the two sub sampling parameters for speeding up the computation. First, the original image is sub-sampled by taking every SubSampRow row and every SubSampCol column. Second, the algorithm is executed on the sub-sampled image. Third, the final assignment is established using the centroids obtained from the sub-sampled version.
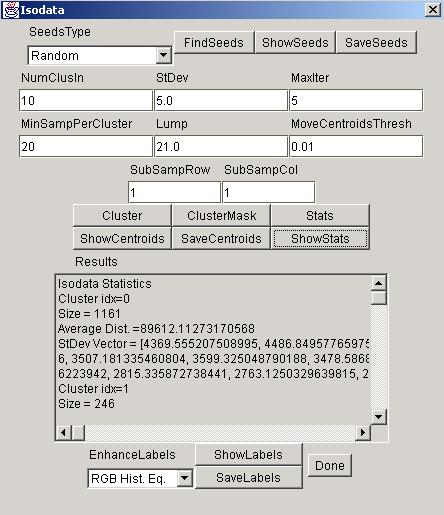
Setup: After all the input parameters were set, a user selects a method for finding seeds. There are currently four methods for finding seeds. First method "First N Points" takes the first NumClusIn points of image as the set of seeds. Second method, "Separated by 2*StDev", searches the current image for NumClusIn seeds that are separated by at least a 2*StDev Euclidean distance. The third method, "Random", selects NumClusIn random points from the current image such that no two seeds are identical. The last method, "Load From File", loads a text file with the seeds. In this case, the value of NumClusIn is updated based on the number of seeds loaded from a file. By clicking "ShowSeeds", the seeds will be displayed in the text area labeled as Results. The button "SaveSeeds" allows the user to run multiple images with the same set of seeds.
If the speed of the algorithm is a major concern then the values of SubSampRow and SubSampCol should be used. These values provide a way for trading the accuracy of the results with the speed of computation. Another way to reduce the execution time is to lower the value of MaxIterations.
Run: To run the algorithm click on the "Cluster" or "ClusterMask" buttons. ClusterMask requires loading a mask file of the same size as the original image to be processed. The mask file should be in a tif file format and its valid pixel should have intensity equal to (byte)-1. The mask can be created by using the Threshold tool.
The button "Stats" computes basic statistics of the final clusters, such as,
- number of points inside of a cluster (Size),
- average Euclidean distance for each cluster (Average Dist.),
- standard deviation vector for each cluster (StDev Vector),
- maximum standard deviation vector (StDevVecMax) with components that are equal to a maximum standard deviation per each dimension of StDev Vector,
- mutual centroids distance for all pairs of cluster centroids.
This set of statistics is shown in the text area labeled as Results after the button "ShowStats" is clicked.
Results:
"ShowCentroids" shows the final centroids in the text area labeled as Results.
"SaveCentroids" saves the final centroids into a text file.
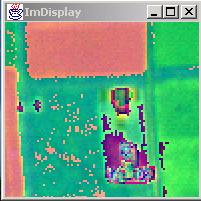
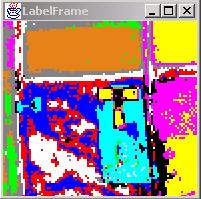
"ShowLabels" creates a new frame with the label image. The choice list "EnhanceLabels" provides some methods for better visualization. The choice "None" leaves the label image intact with the label values ranging from 1 to number of found clusters. Another selection, "Gray Hist. Eq.", enhances the label image in the grayscale domain by maximizing its contrast. Similarly, the choice "RGB Hist. Eq." maximizes the label image contrast in the RGB space. The last choice "Centroid Color" replaces the labels with the corresponding centroids. This particular visualization form is perceptually intuitive for comparing label images with original images.
"SaveLabels" saves the final label image to a hard drive in the image format determined based on the setting in the "EnhanceLabels" choice list.
Release notes: The following parameters cannot be set from the IsodataDialog but might be added to the IsodataDialog in future.
NumClusDelta is the allowed variation of NumClusIn expressed in the percentage of the NumClusIn value. The default value is equal 0.25.
MaxPairLump is the maximum number of cluster pairs that will be merged if their mutual distance is smaller than the parameter Lump. The default value is set to 0.02 * NumClusIn.
MaskVal is the mask value of a valid pixel. The default value is (byte)-1. The current implementation supports a grayscale mask loaded from a tif file. The mask can be easily created by using the Threshold tool.