Class RankBand
The class RankBand provides a tool for ordering image bands based
on five measures, such as, entropy, contrast, ratio, similarity of adjacent bands and
predictability of a band based on adjacent bands.
Description:
Method 1: The band entropy measure is computed from each band separately using information entropy.
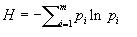
H is entropy measure, p is the probability of a reflectance value in a hyperspectral band and
m is the number of distinct reflectance values.
The probabilities are estimated by computing a histogram of reflectance values.
Generally, if the entropy value H is high then the amount of information in the data is large.
Thus, the bands are ranked in the ascending order from the band with the highest entropy value
(large amount of information) to the band with the smallest entropy value (small amount of information).
Method 2: The band contrast measure is based on the assumption that the input data are used
for classification (discrimination) purposes and therefore high contrast among classes is desirable.
This measure evaluates sharpness (pixel contrast) of each band separately. The larger the contrast measure,
the better the discrimination. The score for each band is normalized with respect to a theoretical model
of a sharp image, such as, a checkerboard image of black and white pixels.
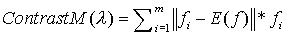
f is the probability density function of all contrast values computed across one band and
lambda is the band characteristic.
The equation includes the contrast magnitude term and the term with the likelihood of contrast occurrence.
Method 3: The similarity of adjacent bands is evaluated based on the first derivative
along the band index axis.
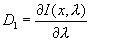
I represents the multi-band value and lambda is the band characteristic.
Thus, if D1 is equal to zero then one of the bands is redundant.
Method 4: The second derivative along the band axis provides a measure
based on linear interpolation (prediction) of a band with its adjacent bands.
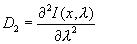
D2 represents the measure of linear deviation, I is a multi-band value and
lambda is the band characteristic.
Similarly to D1, this method explores the bandwidth variable in multi-band imagery
as a function of added information. In contrary to the D1 measure, this approach identifies bands that
can be represented by a linear combination of the adjacent bands. Thus, if two adjacent bands can
linearly interpolate any band, then the band is redundant.
Method 5: In many practical cases, band ratios are effective in revealing information about inverse
relationship between spectral responses to the same phenomenon (e.g., living vegetation
using the normalized difference vegetation index), as well as discovering possible calibration
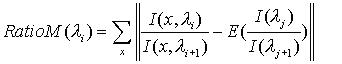
issues among bands. This method explores the band ratio quotients for ranking bands and identifies
bands that differ just by a scaling factor. The larger the deviation from the sample mean scaling
factor, the higher the RatioM value of the band. The mathematical description of this method
is shown below, where RatioM represents the measure, I is a hyperspectral value, x is a spatial location
and lambda is the band characteristic.
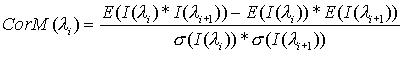
Method 6: One of the standard measures of band similarity is also a normalized correlation.
The normalized correlation metric is a statistical measure that performs well if
a signal-to-noise ratio is large enough. This measure is also less sensitive to local mismatches since
it is based on a global statistical match.
The correlation based band ordering computes the normalized correlation measure for all adjacent pairs of bands.
The bands are ordered from the smallest correlation value to the largest one since two bands contain redundant
information if they are highly correlated.
The mathematical description of the normalized correlation measure
is shown below, where CorrelationM represents the measure, I is a hyperspectral value, x is a spatial location
and lambda is the band characteristic. E denotes an expected value and sigma is a standard deviation.
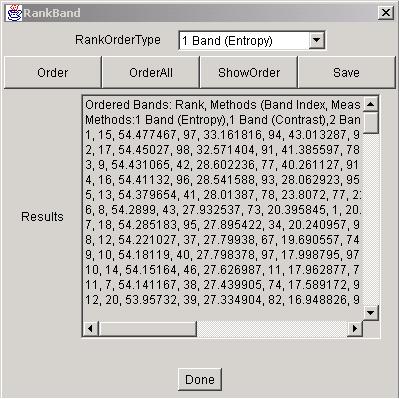
Run:
Each method can be selected from a drop-down menu denoted as "RankOrderType". By clicking the "Order" and
"ShowOrder" buttons, the results will appear sorted from the most "important" band to the least "important"
band with their associated scores scaled between [0,100]. The scores are scaled in order to compare results
generated by several methods. In addition to showing results in the text area (part of the dialog),
the results are plotted in a new window frame.
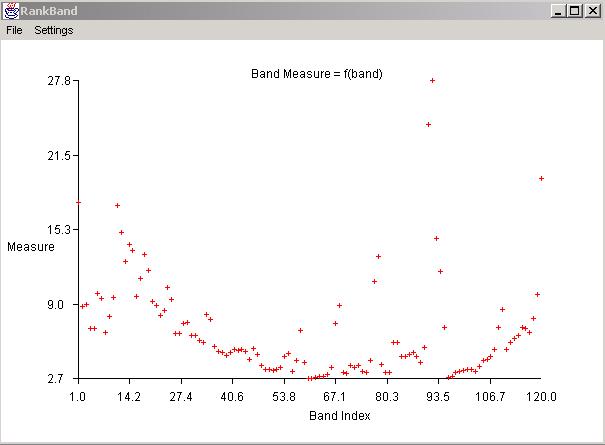
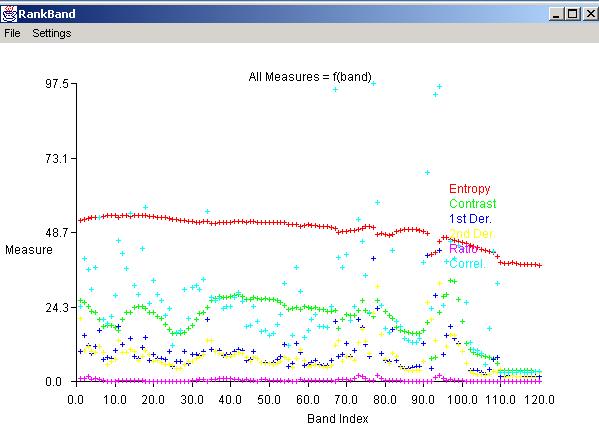
If all methods should be run then the execution is launched by clicking "OrderAll" button. The results are
displayed in the text area (part of the dialog) and in a Plot Window frame (see below)
after initiating "ShowOrder" button.
Saving the results is enabled via "Save" button. The format of the output file is a space delimited text file
that can be easily loaded into Microsoft Excel spread sheet.
Release notes: