|
ECID
Demonstrations |
||
|
|
Anomaly Event Detection Scenario (November 2006) Sensors
are not always reliable, and real-time data can be difficult to validate
manually. An anomaly detector has been implemented within CyberIntegrator
that automatically detects anomalies in real-time sensor data streams and
creates events that trigger alerts to other components of the
cyberenvironment. |
|
|
|
|
|
|
|
|
|
|
|
Funding for ECID technology development comes from the National
Science Foundation and the Office of Naval Research. Interested in ECID?
Join the ecid-support list by sending email to majordomo@ncsa.uiuc.edu with the phrase "subscribe ecid-support" in the body of the email. |
In this scenario, an
environmental researcher studying
|
|
|
The diagram below
illustrates the architecture supporting the information flow in the above
graphic. |
|
|
|
|
|
|
|
|
|
|
|
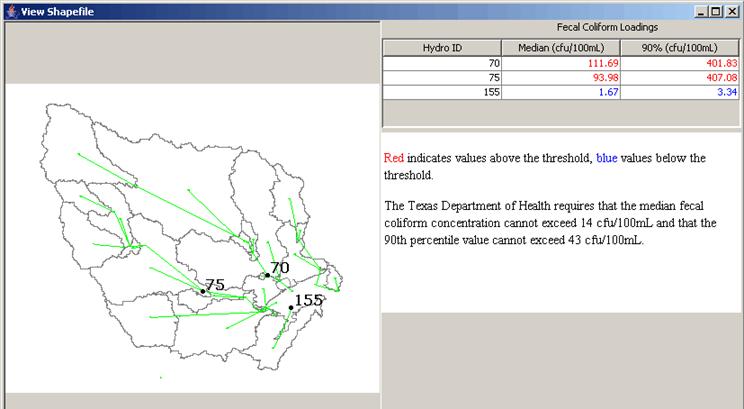
Bacterial TMDL for |
|
|
|
Researchers at the A second spreadsheet downloads USGS data using a Web service and fits
distributions to the data, which were then hand-transferred to the |
|
|
|
|
|
|
|
|
|
|
|
In this demonstration,
these tools were linked in CyberIntegrator to
enable the researchers to automatically pass data from one tool to another at
the click of button. The tools were also linked to a visualization tool
called Image2Learn, which allowed simultaneous display of the likelihood of
exceeding the water quality standards at each schema node (from the
spreadsheet), and an ArcGIS shapefile
of the watershed. |
|
|
|
We
acknowledge Ernest To, Carrie Gibson, and David Maidment
from the |
|
|
|
Remote Sensing Analysis at UIUC Researchers
at the These
remote sensing tools were registered with the CyberIntegrator
to allow more flexible coupling of heterogeneous software tools to form a
sequence of steps, easy re-use and modification of processing steps, and
guidance about community practices from provenance information. |
|
|
|
|
|
|
|
We acknowledge Praveen Kumar and his students from UIUC for
sharing their tools and expertise to prepare this demonstration. |
|