
Learning from Geospatial Data and Images; GeoLearn
We present an exploratory framework for extracting information and knowledge from large size remote sensing imagery. A software prototype called Geospatial Image To Learn (GeoLearn) has been developed.
We also illustrate how an exploratory investigation of vegetation greenness at the US continental scale could lead to discovering unique regions deviating from the vegetation greenness prediction model.
The information is extracted from multiple heterogeneous raster files by deriving new variables, integrating them spatially and temporally, and by selecting pixels using raster quality assurance (QA) criteria as well as other auxiliary information that forms spatial and variable based constraints. From the extracted information, the knowledge is gained by investigating possible relationships among variables using data-driven modeling techniques and by analyzing the models obtained to quantify relevance of independent (input) variables to predicting dependent (output) variables. The terms information and knowledge are illustrated in the context of a class of hydrological hypotheses related to the dynamic evolution of landscape surface variables.
In many applications, GeoLearn could also be used for investigating the sensitivity of the predicted results depending on the data preprocessing, data integration and data-driven modeling parameters, as well as for discovering new relationships using relevance assignment.
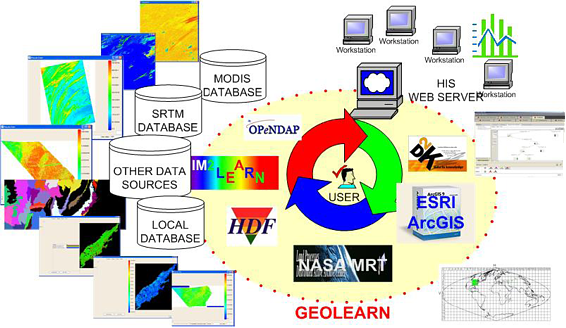
Figure 1: GeoLearn technology overview. Detail description of the Environment is elsewhere.
GeoLearn was used in studies of the vegetation greenness dependency represented by NDVI index on 29 variables including climate, terrain, water and soil characteristics (e.g., precipitation, elevation, land cover, percent silt) using a regression tree modeling technique and by integrating all variables to 1km spatial resolution grid in Albers Equal Area Conic projection.
We designed a methodology and an algorithm for ranking input variables based on their relevance for predicting output variables. Figure 2 illustrates not only the process of data-driven modeling and visualization but also the assistance in interpreting the relevance as a function of space (Fig.2b). In this case, vegetation greenness (NDVI index) is predicted with the leaf area index (LAI), fraction of photo-synthetically active radiation (FPAR) absorbed by the plant canopy and snow cover. As expected, LAI is ranked with the highest relevance at the majority of pixels and snow cover is never ranked with the highest relevance. This type of analysis was used to validate the correctness of relevance assignment based on our prior knowledge.

Figure 2a. Illustration regression tree modeling. Example of the GeoLearn environment.


Figure 2b. Vegetation greenness (NDVI index) is predicted with the leaf area index (LAI), fraction of photo-synthetically active radiation (FPAR) absorbed by the plant canopy and snow cover. Input variable relevance analysis and visualization of modeling error (left) and relevance results (right) in spatial domain.
After performing the Quality Analysis (QA) of each remote sensing image tile, stitching them for each variable, integrating all variables and selecting pixels over the boundary of the US continent, we obtained approximately six million pixels for each variable. Each pixel formed one row in a table with columns corresponding to all extracted variables. The variables in the table were modeled by one regression tree model for the US continent.
In order to discover deviations from the regression tree based model, vegetation greenness was predicted at each pixel using the model and then subtracted from the original vegetation greenness to obtain a residual. Fig. 3 shows the residuals; large deviations from predicted vegetation greenness.

Figure 3: Spatial distribution of a regression tree based modeling for May 2004. The regions with large deviations from "expected" (predicted) vegetation greenness were observed. These are primarily used for agricultural purposes. The blue ellipsoid corresponds to the irrigated valley of the Mississippi river and the green circle highlights the intensively managed fields with corn and soybeans.
Encircled are two regions where deviations are large in magnitude and they are spatially aggregated. The regions are primarily used for agricultural purposes. These data could be understood by realizing that the vegetation greenness in these regions would be controlled more by farming practices than by the natural environment characteristics. This understanding was confirmed by seeing quite a few large residual values in spatially smaller regions with intensively managed land, such as in the north-east (two clusters in Pennsylvania) and west (central valley in California) regions of the US.
Team members
- Praveen Kumar
Civil and Environmental Engineering, UIUC - Peter Bajcsy
Research group ISDA, National Center for Supercomputing Applications, UIUC - Chulyun Kim
ISDA, National Center for Supercomputing Applications, UIUC - Qi Li
ISDA, Computer Science Department, UIUC - Vikas Mehra
Civil and Environmental Engineering (CEE), UIUC - Rob Kooper
ISDA, National Center for Supercomputing Applications, UIUC - Wei-Wen Feng
ISDA, National Center for Supercomputing Applications, UIUC - Yakov Keselman
National Center for Supercomputing Applications, UIUC - Pratyush Sinha
Civil and Environmental Engineering, UIUC - Additional help with the software requirement specifications and code release came from Amanda White (CEE), Ben Ruddel (CEE), and Tim Nee (NCSA).
Acknowledgments
Funding support was provided by National Aeronautics and Space Administration (NASA),
National Archive and Record Administration (NARA), and National Science Foundation (NSF).
The NASA project was led by the principal investigators Praveen Kumar and Peter Bajcsy. Praveen Kumar
served as the principal investigator for the NSF project.
The NARA project was led by the principal investigator Peter Bajcsy.
Presentation
- Peter Bajcsy and Praveen Kumar,
"Cyber-Infrastructure for Critical Zone Explorations in Intensively Managed Landscapes."
Critical Zone Observatory workshop, Penn State, September 16-18, 2007 presentation on Cyber-Infrastructure. - P. Bajcsy, C-Y. Kim, Q. Li, R. Kooper, V. Mehra, R. Robertson and P. Kumar "GeoLearn: An Exploratory Framework for Extracting Information and Knowledge from Remote Sensing Imagery", 32nd International Symposium on Remote Sensing of Environment Sustainable Development Through Global Earth Observations, June 25-29, 2007, San Jose, Costa Rica
- R.D. Robertson, V. Mehra, P. Kumar, P. Bajcsy and D. Tcheng, "Understanding Monthly Land Surface Relationships at the Continental Scale Using Remotely Sensed Data" American Geological Union (AGU) , San Francisco, 11-15, December 2006, Abstract B31A-1060
- Peter Bajcsy, Wei-Wen Feng, and Praveen Kumar, "Relevance Assignment and Fusion of Multiple Learning Methods Applied to Remote Sensing Image Analysis" 2nd IEEE International Conference on Space Mission Challenges for Information Technology (SMC-IT 2006), Pasadena, CA, July 17-21 2006.
- P. Bajcsy, "Data Processing and Analysis.", Section IV (pp. 258-378) in Hydroinformatics: Data Integrative Approaches in Computation, Analysis, and Modeling, eds. P. Kumar, J. Alameda, P. Bajcsy, M. Folk and M. Markus, vol. 2, p534, CRC Press LLC 2006. [cover jpg] [content pdf 26kB]
- P. Kumar, P. Bajcsy, D. Tcheng, D. Clutter, V. Mehra, W-W Feng, P. Sinha and A. White, "Using D2K Data Mining Platform for Understanding the Dynamic Evolution of Land-Surface Variables.", 2005 Earth-Sun System Technology Conference, University of Maryland, MD, June 28-30, 2005. [abstract] [pdf 268kB]
- P. Kumar, P. Bajcsy, D. Tcheng, D. Clutter, V. Mehra, W-W Feng, P. Sinha and A. White, "Using D2K Data Mining Platform for Understanding the Dynamic Evolution of Land-Surface Variables.", Proceedings of the 2005 Earth-Sun System Technology Conference, University of Maryland, MD, June 28-30, 2005. [abstract] [pdf 268kB]
- P. Bajcsy, "Data Processing and Analysis.", Section IV (pp. 258-378) in Hydroinformatics: Data Integrative Approaches in Computation, Analysis, and Modeling, eds. P. Kumar, J. Alameda, P. Bajcsy, M. Folk and M. Markus, vol. 2, p534, CRC Press LLC 2006. [cover jpg] [content pdf 26kB]
- P. Kumar, P. Bajcsy, D. Tcheng, D. Clutter, V. Mehra, W-.W. Feng, P. Sinha and A. White, "Data Driven Discovery", Status Report Hydrologic Information System, CUAHSI Universities allied for water research, Editor: David Maidment, Version 1, September 15, 2005, pp.188-203.
References
- A. Anyamba, and J.R. Eastman, "Interannual variability of NDVI over Africa and its relation to El Niño Southern Oscillation", Int. J. Rem. Sens., 17(13), 2533-2548 (1996).
- J. Han and M. Kamber, "Data Mining: Concepts and Techniques", Morgan Kaufmann, San Francisco, CA. (2001)
- J. Mennis, "Exploring relationships between ENSO and vegetation vigour in the south-east USA using AVHRR data", Int. J. Rem. Sens., 22(16), 3077-3092 (2001).
- U.S. EPA and CEC (2002), " Ecological Regions of North America - Towards a Common Perspective", Commission for Environmental Cooperation (CEC).
- A.B. White, "Vegetation Variability and Its Hydro-Climatologic Dependence". Ph.D. Dissertation, Civil and Environmental Engineering, University of Illinois at Urbana-Champaign, 2005.

![[cover jpg]](../peter/publications/books/hydroinformatics_Cover.jpg)
![[cover jpg]](.//peter/publications/books/hydroinformatics_Cover.jpg)