
 University of Illinois
at Urbana-Champaign


|
About
February 12, 2009 marks the bicentennial celebration of the birth of America's 16th president Abraham Lincoln. Local communities and counties,
state and federal agencies are planning and organizing the celebrations. Illinois' efforts, for example is coordinated by
the Illinois Lincoln Bicentennial Commission. The general goal of our work is to promote learning about Abraham Lincoln via web-based interface. The purpose of the work is to develop web based information repository for pedagogical use. Our project consists of two parts: scientific (image processing) and educational. Scientific: part of our broader interest in manipulation and image processing of terabytes of data (large volume of historical paper documents, geographical maps etc.). Educational: web-based accessibility of Lincoln's writings for scholars, students and public. The system combines already traditional learning (e.g. Google Maps); interactive learning by querying data content, and exploratory and forensic studies about characteristics of historical documents and their relationship to historical events. We hope that with our work we can:
Documents search - DemoMulti dimensional view of the data.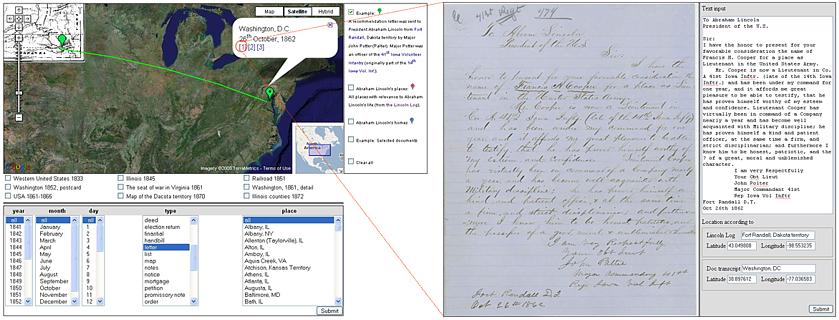
Figure 1. Web-based interface: In this example a letter was sent from Fort Randall to president Abraham Lincoln on October 26, 1862. The bits of information about the document (metadata) namely the time, the location of a sender and the location of President Lincoln are known. The letter path is visualized in Google Maps, the document can be retrieved from the database and edited. Additionally, user can overlay one of the historical maps. The markers are positioned with high accuracy based on the latitude and longitude of historical sites. 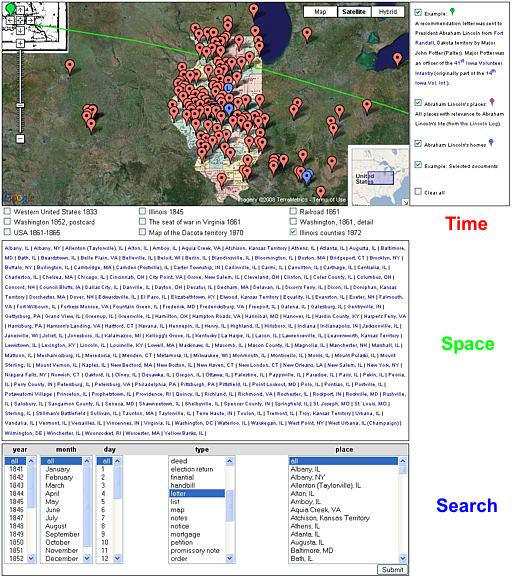
Figure 2. Places with relevance to Abraham Lincoln's life. Multidimensional information in time (historical maps), space (places - markers in the Map) and document (search) dimension. 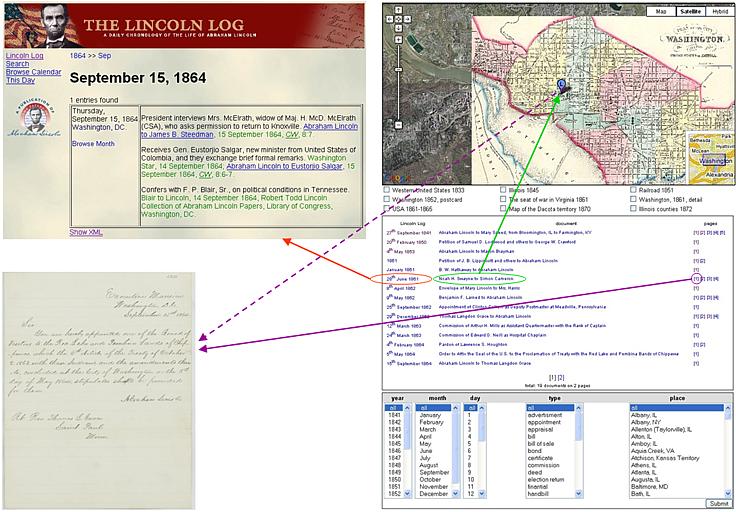
Figure 3. Hyperlink to The Lincoln log: A Daily Chronology of the Life of Abraham Lincoln (temporal representation), Hyperlink to the Markers (spatial representation) and Hyperlinks to the Image scans (document content). Abraham Lincoln resources
Project technical overview
Architecture diagram.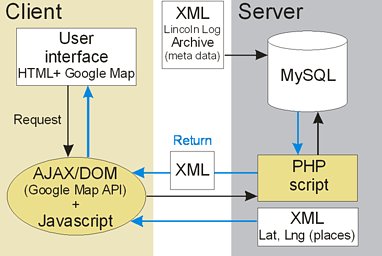
The front-end consists of an HTML file with Google Map loaded, a search form and a pre-defined data sets, and a JavaScript script. Users can search the database, view the results, view individual documents, edit or transcribe them, delete existing postings or add new ones. Historical Maps.Maps have to be processed in order to overlay them on the Google Maps. It can be a tedious process since the geodetic information is not always available. The geodetic coordinate system consists of a datum, a projection, an origin, a unit system and two axis. Google Maps uses WGS84, Mercator projection and a pixel unit system. Most of the maps of the United States are in conical projection, Lambert Conformal Conic and Albers Equal Area or in Molweide Pseudocylindrical Projection. 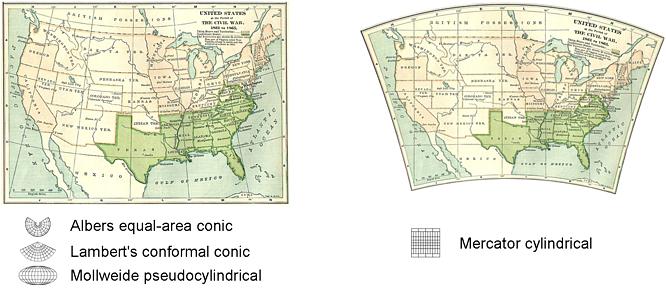
In our case the projection does not have to be exact. For small areas in Molweide projection, for example a simple perspective correction can be sufficient. A map projection is a process which converts spherical or ellipsoidal surface (3d) to a projection surface (2d). Large size collection and data processing
Automatic classification and cropping of very large size collections of scanned paper documents.The papers represent a large collection of incoming and outgoing correspondence of Abraham Lincoln. The ultimate goal of these images is to provide an online research and reference work that will provide the color images, transcriptions, and editorial matter for these historical documents, including Lincoln's extensive legal practice. In order to preserve the color scale, the paper documents are scanned together with the color scale bar, e.g., the Kodak Q13 Color Separation Guide. While the color scale bars are important for reproduction and information preservation about true color, brightness and contrast, they might have to be removed from the on-line electronic documents. The average image size is about 150 MB. Currently, there are about 23,000 scanned document images (3.45 TB), but the expected amount is 200,000 or 300,000 images (45 TB). The collection is characterized by a large variability of paper and ink colors in image scans, of the density of writing (text to background ratio). Finally position of the color scale bar differs among subsets of the documents. 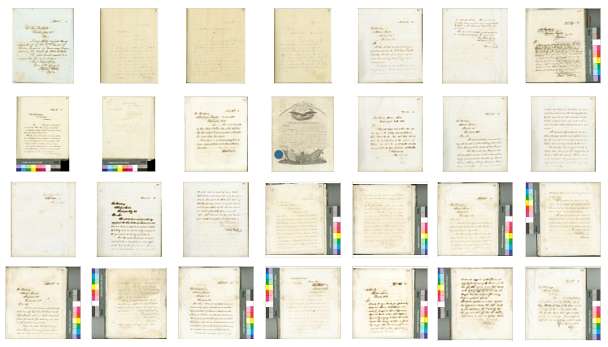
Automated Extraction of Areas of Interest from Scanned Documents of Abraham Lincoln Writings.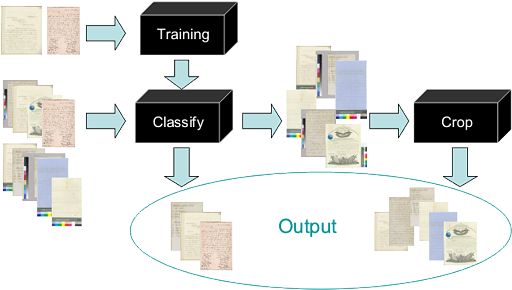
In our work, we design algorithms for automatic classification of images containing the documents with or without additional background patterns. Then, the images with background are automatically analyzed to identify the crop region containing only the documents. Finally, the algorithms will be applied to a large volume of images that will consist of 103 to 105 pages with each page equal to about 150MB. The cropped images will be available on-line via the Illinois Historic Preservation Agency and the Abraham Lincoln Presidential Library and Museum in the future. We define an "ideal document image" with following attributes: the paper region is rectangular, the paper color is constant, the handwritings ink color is constant, the handwritings distribute "uniformly" over the paper, the paper covers the most area of the image including its center, the background color is different to the paper color. There may be a color scale bar placed in the top, bottom, left or right side of the image, which does not overlap with the paper region. The algorithm is divided in to 3 main stages: Training, Classify and Crop. 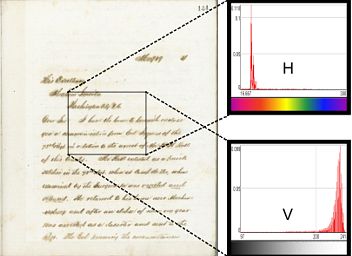
Hue and Intensity (Value) components of the histogram. Before starting the training and classifying stages, every image is sliced into MxN tiles, and each tile is converted to HSV color space and analyzed
to generate the Hue distribution histogram. All the following stages are performed over the tiles histograms of the images, leading to a reduction
in the amount of data to process. The training stage calculates the necessary parameters for the classification and cropping. A residual (correlation) factor R is computed from the normalized histograms of two, center and off center tiles, in order to decide if a tile belongs to the ink and paper region or if it should be left out. Factor R is ranging over a difference color distribution interval [0,2] with 0 for equal color distribution of both tiles and 2 for a maximum difference in the Hue space. The training stage can take a subset of the images (e.g. images without the color bar) and estimate interval of R. Another option is to skip the training stage and set R as an a priori known value. The classification stage determines the subset of images that need to be cropped again based on values of the factors R. The cropping stage is applied over the images classified as "not just paper and ink" (mainly images with the color bar). It has the objective of estimating an ideal cropping area and removing background and color scale palettes. The cropping area boundary is simply a rectangle aligned to the entire image borders. 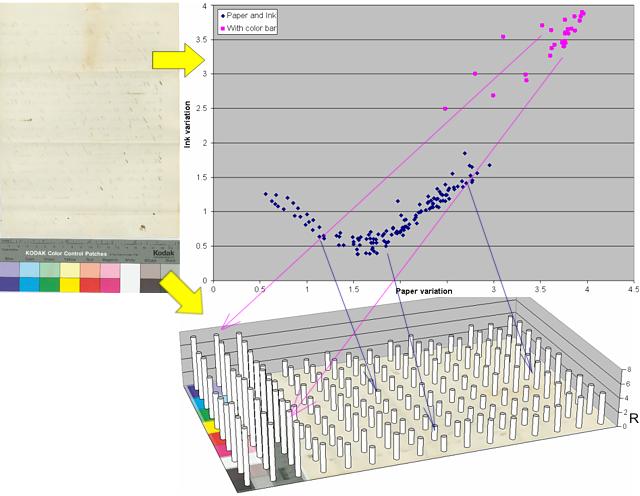
Above: The document is converted to tiles and HSV-histogram of each tile is computed. Using normalized histograms of two, center and off center tiles, residual factor R is obtained for each pair. We postulate that the center region of the image always belongs to the paper content (. Only the tiles with "similar" histograms are detected as paper tiles, other are treated as color bars. The former are represented by the blue R points the latter by the red points. Left image shows tiles and their R bar representation. We have implemented four versions of the classification algorithm with ot without the training stage and with different classification criteria for the factor R:
The four versions were tested using a subset of 348 images. The training set for the first algorithm consisted on 174 files without the color bar. The most accurate algorithm (the first one) gives almost 100% accuracy. The main disadvantage is that the training process is analogous to classifying process and the computation is doing twice the same work: crop center, tile image, generate histograms, compare histograms...). The algorithm without the training (the fourth) gives 96.6% accuracy. The optimization of the process is still in progress. Summary

People and Presentations
Team members
Funding was peovided by the Office of the Provost, UIUC and NCSA. |

