Hyperspectral Imagery for Band Selection in Agricultural Applications
Precision farming practices are conceptually based on within−field variability information. Modern sensing technologies including remote sensing for information gathering results in large volumes of raw data. Remote sensing can provide high−resolution data on geospatial variability in yield−limiting soil and crop variables. It can be used for mapping soil characteristics, leaf area index (LAI), crop development, canopy coverage, pest infestation, plant water content, and crop stresses Lack of data mining tools and inability of agriculture producers and consultants to extract useful information from large volumes of raw data on yield−limiting factors is a major hurdle in the widespread application of remote sensing at production level.
In our project we propose methods for unsupervised and supervised band selection and their application to hyperspectral data collected for precision farming.
Common problems in the area of hyperspectral analysis involving data relevancy include optimal selections of wavelength, number of bands, and spatial and spectral resolution. Our goal is to evaluate five methods for band selection from hyperspectral data with or without knowledge of the application domain. Signature bands can be extracted by using two fundamental approaches: unsupervised and supervised. The unsupervised approaches are application independent. They include information entropy measure and first and second derivatives along the spectral axis. The supervised approaches select hyperspectral bands based on supplemental ground data using principal component analysis (PCA) and an artificial neural network (ANN) based model.
The three major objectives of our study were to:
- Research and develop three unsupervised methods for rank ordering of bands from hyperspectral imagery. The methods are based on evaluation of each band separately with three different criteria. The first method is based on an information entropy criterion. The second and third methods are based on a residual criterion derived from the first and second derivatives along spectral axis with two and three adjacent bands, respectively.
- Design and implement two supervised methods based on ANN and PCA that use ground truth data for band selection.
- Compare the results obtained from the unsupervised and supervised methods.
Remote sensing data were acquired from three agricultural fields located in the Midwest U.S, in Missouri, and in Illinois. Hyperspectral image data were collected in April and June, 2000. The supplemental ground data included two measures of apparent soil electrical conductivity (ECa, in mS/m) measured with two different devices. The first device was a Geonics EM−38RT (Geomatrix Earth Science, Ltd., Hockliffe, U.K.), which measured ECa in the top 120 cm of soil using a non−invasive method called electromagnetic (EM) induction. The second device was a VERIS 3100 soil mapping system, which is a direct−contact soil EC meter. The VERIS shallow (VERIS−s) represented the ECa for the top 33 cm soil, and the VERIS deep (VERIS−d) represented the ECa for the top 100 cm soil. The ground data for Illinois field included canopy coverage, measured as a fraction of ground area covered by crop canopy. The canopy coverage was measured for every 16 cm square area in the field with a vehicle−mounted vision system. The ECa is a good indicator of yield−limiting soil physical and chemical properties such as soil texture, Ca, Mg, K, and CEC in some soils, and soil water content. The soil EC measurements have long been used to identify contrasting soil properties in the geolog- ical and environmental domains.
The image data were collected from an aerial platform with a NASA RDACS/H−3, 120−channel prism−grating, pushbroom hyperspectral sensor. Each image had 120 bands per pixel which corresponded to the visible to near−infrared range of 471 to 828 nm, recorded at a spectral resolution of 3 nm. The hyperspectral sensor was mounted on a fixed−wing aircraft and was flown over the fields for data collection. The images were collected from altitudes of approximately 1200 m and 2250 m. The motivation for choosing the wavelength range 400-900 nm responds to 18 common plant characteristics very well and has been used for vegetation sensing in the past. By selecting this wavelength range, the data analysis avoids issues related to water absorption bands (1400 nm and 1900 nm).
The image preprocessing included four steps: (1) image calibration for sensor noise, (2) correction for geometric distortion caused by platform motion, (3) image georegistration, and (4) image calibration for variable illumination.
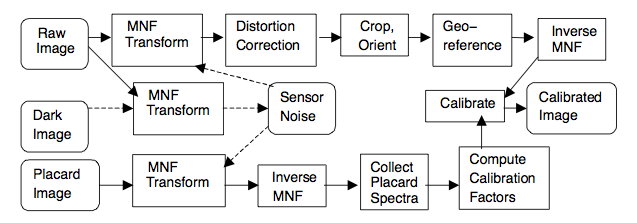
Flowchart showing the steps in image preprocessing for correction, georeferencing, and calibration (“MNF transform” refers to minimum noise fraction transformation).
Image distortion caused by aircraft roll: The image shows gradual shifting of linear features, resulting in a distorted field boundary. To eliminate roll, first a known linear feature along the in−track direction was identified in the image. Then each row of the image was shifted in the cross−track direction to straighten the known linear feature. After correcting the image for geometric error caused by platform roll, the image layout appeared closer to the actual field layout.
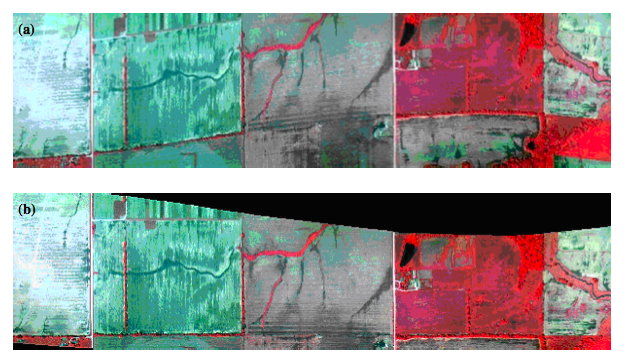
A raw image of field 1: (a) platform−based image distortion, and (b) after correcting for error caused by platform roll.
Unsupervised methods for band selection:
- Method 1: Information Entropy - is based on evaluating each band separately using the entropy measure (H) and the probability of occurrence of a digital number in a hyper-spectral band. Generally, if the entropy value is high, then the amount of information in the data is large.
- Method 2: First Spectral Derivative - The bandwidth of each band can be a variable in hyperspectral sensor design. The first spectral derivative method explores the bandwidth variable as a function of added information. In general, adjacent bands that differ a lot should be preserved for characterization, while similar adjacent bands can be reduced.
- Method 3: Second Spectral Derivative - Similar to method 2, the second spectral derivative explores the bandwidth variable in hyperspectral imagery as a function of added information. Contrary to method 2, this approach identifies bands that can be represented by a linear combination of adjacent bands. Thus, if two adjacent bands can linearly interpolate the third band, then the third band is redundant.
Supervised methods for band selection:
- Method 4: Artificial Neural Network (ANN) - Artificial neural networks are used in a wide variety of applications and in many disciplines because of their robustness in making predictions based on training examples. They are particularly applicable in agricultural problems for modeling complex relationships, where stochastic factors play major roles. A multilayer feed−forward ANN was used for the training. A genetic algorithm was used to optimize ANN topology. A non−standard activation function called Elliot’s Proposed Activation Function was used to obtain the final results. The hyperspectral bands were ranked based on their sensitivity to the ANN output value. A band with a high sensitivity had a high rank. The ANN processed a subset of the training data set. Every band input varied between 0.1 and 0.9 with a 0.05 increment for each band. After all the training examples had been explored, the mean score for each band was calculated. The rank of the best 60 bands based on the mean range of predictions for an ANN of 120 bands was retained for further examination.
- Method 5: Principal Component Analysis (PCA) - Multivariate analysis using PCA was conducted on 120 bands of the image to obtain the most significant bands characterizing spatial variability in a specific target charac- teristics represented in the field data. The PCA transformed the auto−correlated hyperspectral image bands to uncorrelated principal components based on the band covariance matrix. A correlation analysis was performed between the principal components or bands of the transformed image and the ground truth data. The most significant bands were identified from their corresponding eigenvectors in the principal component that showed maximum correlation with the field data. The maximum variance in the image is carried by the first principal component image, and the variance decreases for higher−order principal components. Therefore, the first few principal components are expected to represent the global variability in the image scene, and the latter principal components are expected to represent information on local variability, such as the variability in the target characteristics explored in this study.
Results
Unsupervised methods:
Near−infrared bands of soil images showed larger variability within each bands. We expected to see more variability in color bands since clay characteristics and mineral contents are expressed more in color bands than in NIR bands. However, crop residue may be one reason for the strong band variance in the NIR bands of a soil image. The partially vegetated image showed highest entropy values in the red region of 627−684 nm. These red bands signify plant pigment absorption, mainly due to chlorophyll.
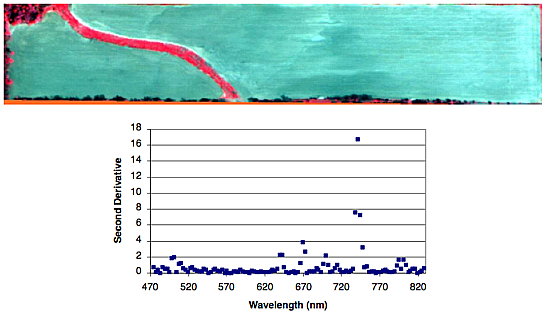
Hyperspectral image of bare soil and the second derivative measure (bottom) used for identifying bands with non−redundant information, plotted against band wavelength.
The first and second derivative measures compared the spectral derivatives between adjacent bands to select wavebands. Derivative measures showed several significant bands in the 690−705 nm range for both soil and partial canopy image. The top 20 soil image bands from derivative measures also included several bands in the 500−510 nm, 735−750 nm, and 800−805 nm ranges. The top 20 bands for partial canopy image included 714−717 nm, 740−755 nm, 810−825 nm, and a few green bands. This means that there is significant amount of information in the green, far red, red edge, and NIR regions that is relevant to soil characteristics and canopy cover. Visible light bands responded to soil characteristics very well. Soil organic matter and residue may have contributed to the variations in the NIR bands in soil images. Both color and NIR bands responded well to partially vegetated image. These results were consistent with theoretical expectations and published research findings that NIR, far red, and red edge areas of the electromagnetic spectrum carry valuable information on crop and soil characteristics.
Supervised methods:
The outcome of sensitivity analysis of bands with an ANN model is shown as a mean prediction range against the band wavelength. The band sensitivity differed significantly among the bands, varying from 0 to 0.5. The spectral bands at chlorophyll absorption and red shift showed the maximum sensitivity. The NIR and red regions are understandably more responsive to partially vegetated fields because of the role of plant pigments in attenuating visible light bands and of biomass (cell structure) in attenuating NIR wavelengths. The soil image showed a mixed set of individual narrow bands from the visible and red edge regions. The red edge (740−747 nm), green (540−546 nm), and scattered red bands in the range of 640−675 nm were most sensitive to ECa. The significant differences in band sensitivity to soil ECa and canopy density provide validity to the concept of signature bands, which are narrow wavebands that are most responsive to a target characteristic.
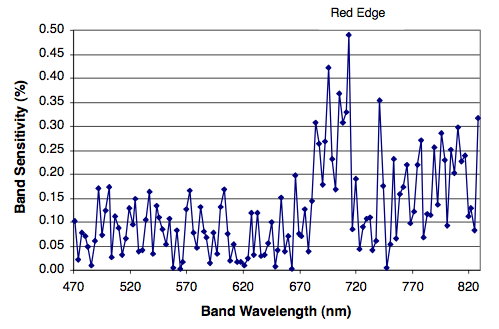
Band sensitivity of hyperspectral image data estimated with a supervised neural network model, plotted against wavelength for a partially vegetated field (Illinois field).
Most of the variability in the images was represented by the first ten principal components. The first three to four principal components showed a gradual trend in the contribution of individual bands represented by their eigenvector. During our investigation of principal components with respect to ground truth data, different higher−order principal components showed significant correlation to soil apparent electrical conductivity and crop canopy. For the bare soil image, principal components 4, 5, and 7 showed the highest correlation with the three measures of soil electrical conductivity. VERIS deep showed maximum correlation of 0.39 with PC4, EM showed maximum correlation of 0.49 with PC5, and VERIS shallow showed a maximum correlation of 0.37 with PC7. Although some of the surface factors such as soil moisture, clay content, and mineral concentration that contribute to ECa affect soil reflectance, ECa characteristics of deeper layers may not affect soil reflectance.
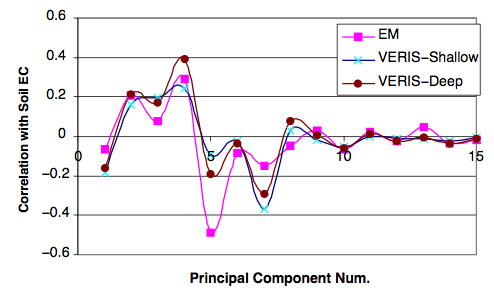
Correlation between principal components and soil characteristics plotted against principal component bands derived from hyperspectral images of bare soil.
Conclusion
Overall, the ANN has the capability to learn the subtle changes in scene reflectance caused by a specific scene characteristic in spite of large variations in the total scene reflectance. The ANN measure based on band sensitivity compared the information added by a single band in a model to characterize a specific target variable. Therefore, the ANN measure is capable reducing information redundancy be- tween the selected bands. In addition to identifying the most responsive bands, the ANN measure can also be used for application−specific data compression. With the exception of the entropy measure, all methods selected several bands from the 740−750 nm range among the top 20 from all three field images, and 690−710 from the partially vegetated image of Illinois field. Therefore, we recom-mend that future sensor designs for agriculture and environ- mental applications may include narrow wavebands (10 nm or less) in these two regions.
Collaborators
- Peter Bajcsy
Image Spatial Data Analysis Group, NCSA, UIUC - Sreekala G Bajwa
Assistant Professor, Department of Biological and Agricultural Engineering, University of Arkansas, Fayetteville, Arkansas - Lei F. Tian
Associate Professor, Department of Biological and Agricultural Engineering, UIUC - Rob Kooper
ISDA, NCSA, UIUC - Peter Groves
Graduate Student, Department of Computer Sciences, UIUC
Papers
- S.G. Bajwa, P. Bajcsy, P. Groves, L.F. Tian, "Hyperspectral image data mining for band selection in agricultural applications." Transactions of the American Society of Agricultural Engineers 47, p895-907 (2004). [abstract] [pdf 1.3MB]
- P. Bajcsy and P. Groves, "Methodology For Hyperspectral Band Selection." Photogrammetric Engineering and Remote Sensing 70, p793-802 (2004) [abstract] [pdf 485kB]
- P. Bajcsy, R. Kooper, "Prediction Accuracy of Color Imagery from Hyperspectral Imagery.", Proceedings of the SPIE on Defense and Security 2005, Conference: Algorithms and Technologies for Multispectral, Hyperspectral, and Ultraspectral Imagery XI, 5806-34, March 28-April 1, 2005, Orlando (Kissimmee), Florida, USA. [abstract] [pdf 581kB]


