The goal of microarray image analysis is to extract intensity descriptors from each spot that represent gene expression levels and input features for further analysis. Biological conclusions are then drawn based on the results from data mining and statistical analysis of all extracted features.
Components of DNA Microarray image analysis are (1) Grid Alignment Problem, (2) Foreground Separation, (3) Quality Assurance, (4) Quantification and (5) Normalization. Additionally, the data management must conform with the Minimal Information About Microarray Experiments (MIAME) standard.
Input: Laser image scans (data) and underlying experiment hypotheses or experiment
designs (prior knowledge).
Output: Conclusions about statistical behavior of measurements and thus the the test of the
hypotheses or knowledge. The results are derived automatically from data (machine learning perspective) for subsequent model fitting.
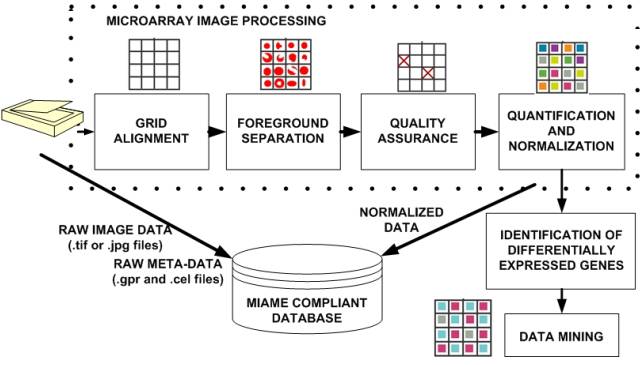
Microarray data processing workflow.
Microarray grid alignment and foreground separation are the basic processing steps of DNA microarray images that affect the quality of gene expression information, and hence impact our confidence in any data-derived biological conclusions. Thus, understanding microarray data processing steps becomes critical for performing optimal microarray data analysis.
The workflow of microarray data processing starts with raw image data acquired with laser scanners and ends with the results of data mining that have to be interpreted by biologists. The microarray data processing workflow includes issues related to (1) data management (e.g., MIAME compliant database, (2) image processing (grid alignment, foreground separation, spot quality assessment, data quantification and normalization, (3) data analysis (identification of differentially expressed genes, data mining, integration with other knowledge sources, and quality and repeatability assessments of results, and (4) biological interpretation (visualization). The main objective of this project is related to image processing, namely grid alignment, foreground separation, spot quality assessment, data quantification, normalization and visualization.
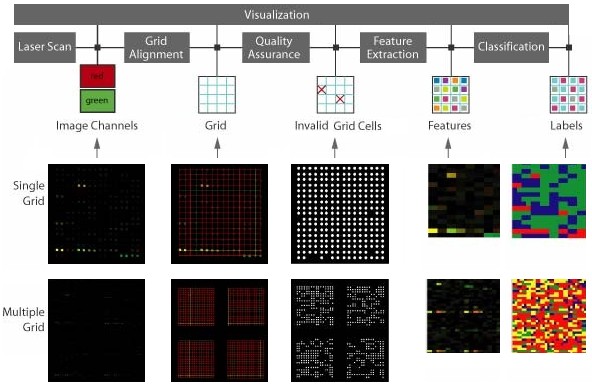
Microarray data processing workflow: Fluorescent DNA microarray images obtained from laser scanners containing a 2D array of dots with two channels of 532nm (red) and 632nm (green) wavelengths. The grid alignment is performed producing a set of lines intersecting at each dot. Dots define a valid foreground. Quality assurance screening eliminates grid cells with unreliable microarray information. Finally, image of sample mean values extracted at each grid cell using particular mask is extracted and colored in a red-green-blue space with color assigned to each cluster/pixel. Statistics of each cluster can be viewed in the text area.
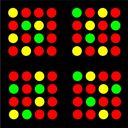
Ideal Microarray Image: 2D illustration of an ideal microarray image with constant grid geometry, known background intensity with zero uncertainty, infinite spatial resolution. It would also have predefined spot shape (morphology), and constant spot intensity that (a) is different from the background, (b) is directly proportional to the biological phenomenon (up- or down-regulation), and (c) has zero uncertainty for all spots. For multichannel microarray images, the same characteristics of an ideal image apply to each image channel and the channels are perfectly aligned. One microarray image can also contain multiple subgrids. Additionally an ideal cDNA microarray image in terms of statistical confidence should have a very large number of pixels per spot.
Variations in microarray image Data processing:
- microarray technologies (microarray image channels), file formats, data accuracy,
- grid geometry,
- foreground and background intensity,
- spot morphology
Grid geometry and alignment.
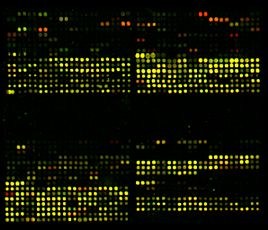
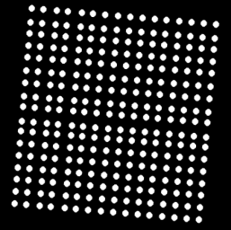
Left: Multiple grids. The lower right sub-grid has one less row than other subgrids.Right: An example of a synthetic image with a rotated 2D array.
A grid alignment (also known as addressing or spot finding or gridding) is one of the processing steps in microarray image analysis that registers a set of unevenly spaced, parallel, and perpendicular lines (a template) with the image content representing a two-dimensional (2D) array of spots.
Grid alignment methods: Manual grid alignment, semiautomated grid alignment and fully automated grid alignment.
Our main interest is in the last, automated method which should reliably identify all spots without any human intervention based on one-time human setup. The one-time setup is for incorporating any prior knowledge about an image microarray layout into the grid alignment algorithms in order to reduce their parameter search space. Typically, this method is data-driven and have to optimize internally multiple algorithmic parameters in its parameter search space to compensate for microarray image variations.
The Grid Line algorithm is data driven and its goal is to find a set of mutually perpendicular lines that intersect at a center of each grid cell obtained from DNA microarray laser scanners. The dots have generally (i) varying radii and (ii) their position deviates from a perfect grid placement. A grid cell is defined as an area enclosing one dot and is a part of a 2D array of dots.
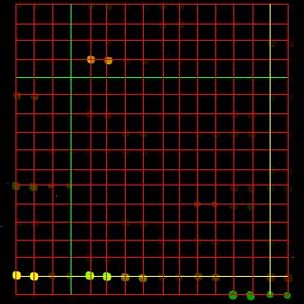
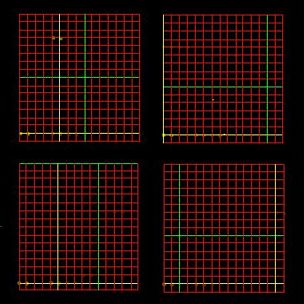
Grid over the DNA microarray image, single array and multiple arrays. The resulting grid will be overlaid on the original image with a red color denoting grid lines. The horizontal and vertical lines that were obtained with the highest score are drawn yellow and with the lowest score are drawn green.
Line directions are not constrained and therefore any translated and rotated 2D array of dots can be detected. Furthermore, multiple distinct 2D arrays (grids) can be found as well by partitioning an input image into subimages and aligning each distinct grid separately.
Foreground and background detection.
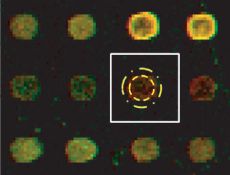
Illustration of a grid cell and the separation using spatial concentric circular templates.
The outcome of grid alignment is an approximation of spot locations. The next task is to identify pixels that belong to foreground (signal) of expected spot shape and to background. This task involves image segmentation and clustering. Image segmentation is associated with the problem of partitioning an image into spatially contiguous regions with similar properties (e.g., color or texture), while the term image clustering refers to the problem of partitioning an image into sets of pixels with similar properties (e.g., intensity, color, or texture) but not necessarily connected.
We describe next the foreground separation methods using (1) spatial templates, (2) intensity-based clustering, (3) intensity-based segmentation, and (4) spatial and intensity information.
The foreground separation using spatial templates assumes that a spot is centered inside of a grid cell and it closely matches the expected spot morphology. The spatial template consists typically of two concentric circles, where the pixels inside of the smaller circle are labeled as foreground (signal) and the pixels outside of the larger circle are labeled as background. All pixels in between of the two concentric circles are viewed as transition pixels and are not used. Clearly, this type of foreground separation will fail for spots with varying radii or spatial offsets from the grid cell center, and will include all pixels with artifacts (e.g., dust particles, scratches, or spot contaminants). The consequence of poor signal separation will lead to artificially increased background level and distorted signal-to-background ratio.
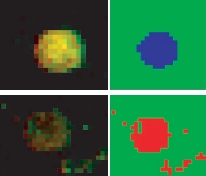
Examples of accurate (top) and inaccurate (bottom) foreground separation using intensity-based clustering.
Foreground separation using intensity-based clustering uses image thresholding whixh is executed by choosing a threshold intensity value and assigning the signal label to all pixels that are above (or below depending on dark-bright scheme) the threshold value. The threshold value can be chosen by computing the expected percentage of spot pixels inside of a grid cell based on the knowledge about image resolution and spot radius.
Foreground separation using intensity-based segmentation, such as seeded region growing, watershed segmentation and active contour models use seeds, a set of input pixel locations. The segmentation method groups simultaneously pixels of similar intensities with the seeds to form a set of contiguous pixels (regions). The grouping is executed incrementally for a decreasing similarity threshold.

An example (left) of pros and cons of foreground separation using intensity-based clustering and segmentation: original image, segmentation result and clustering result. The results were obtained using the advanced K-means and region growing algorithms.
It has to be point out that we do not address the issue of foreground spot intensity variations. The microarray images represent experiments of a discovery type and spot intensity profiles are part of the scientific equation. Thus, one should only adjust parameters of measurement instruments to fully cover the dynamic range of spot intensities so that intensity values are not saturated and possibly discernable from others. As of now, intensities of each spot are modeled according to our previously described ideal microarray image but future research might reveal additional information in the intensity profiles of individual spots.
Background variations occur due to microarray slide preparation (hybridization and spotting errors), inappropriate acquisition procedures (presence of dust or dirt) and image acquisition instruments (non-linearity of imaging components). While the first two types of background variations should be detected by microarray quality assurance, the variation due to image acquisition instruments cannot be removed by a user. Thus, many image processing algorithms compensate for background variations by modeling its probability distribution function with the most frequent model being the Gaussian PDF.
Examples of grid alignment for various spot shapes.
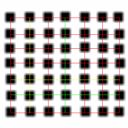
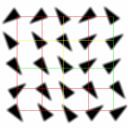

Left: Square and triangular spot morphologies. Right image shows variations of spots; a regular spot, an inverse spot or a ghost shape, a spatially deviating spot inside of a grid cell, a spot radius deviation, a tapering spot or a comet shape, spot with a hole or a doughnut shape, a partially missing spot and a scratched spot.
Another issue to mention is the shape of microarray grid elements (or grid shape primitives). Although the majority of current cDNA microarray imagery is produced with circular spots as shape primitives, one can find the use of other primitive shapes, e.g., lines or rectangles. It is very likely that other primitive shapes than a round spot shape will be used in microarray technology in the future.
For the currently most common circular spots, there exist a large number of shape deviations (equals to the total number of foreground and background pixel combinations inside of a grid cell). A few classes of morphological deviations as found in microarray images is shown in the figure. There are many more spot deviations that have to be analyzed during spot quality assessment. The goal of assessment is to determine a validity of measured spot information and our confidence in deriving any conclusions based on the spot measurement.
Example: Fluorescent cDNA microarray containing a 2D array of dots with two channels
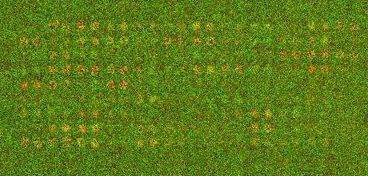
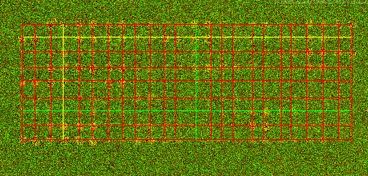
Fluorescent cDNA microarray images containing a 2D array of dots with two channels of 532nm (red) and 632nm (green) wavelengths (left). The grid alignment is performed producing a set of lines intersecting at each dot. Dots define a valid foreground.
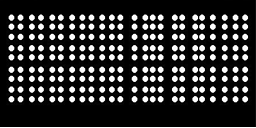
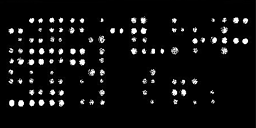
(a) Results obtained without any screening (Dot Radius = 5.0) and (b) with Euclidean mask type obtained with location and size screening.
Part of a reliable information extraction (quality assurance - QA) of the microaray image is the process of elimination of the grid cells with unreliable microarray information. This is done by running the screening algorithm which performs four types of quality assurance. It is assumed that a grid of cirular dots has been detected. The result of any screening is a mask image that can be viewed with the corresponding information about the screening, for example, a number of valid dots (grid cells), an average dot radius or a histogram of PDF models if the statistics is used.
Screening of a microarray image
is conducted either globally with data statistics computed over the whole image or locally with statistical analysis of each
grid cell. The global screening eliminates grid cells that contain sample mean intensity in all bands of the foreground area
(signal or dot area) smaller than the sample mean intensity of the background plus three standard deviations computed from
the overall background. The local screening is based on location and size, signal to noise ratio (SNR), topology
of signal area and statistical models of the signal intensities. The goal of local screening is to eliminate grid cells
with (1) circular signal area outside of allowed location and radius deviations, (2) small signal with respect to background,
(3) disconnected signal areas and (4) inconsistent intensity probability distributions.
If one does not select any screening then all grid cells are considered to be valid with a circular area (dot) of the radius
defined by Dot Radius input value and a center location defined by the center of a grid cell.
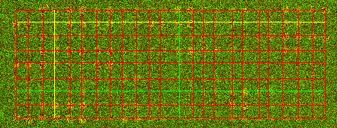
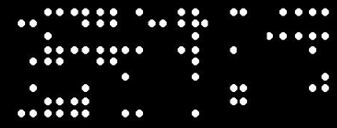
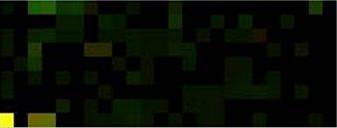
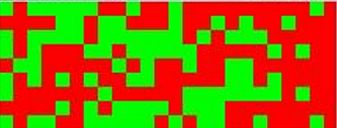
Top: The grid alignment is performed on the DNA Microarray image producing a set of lines intersecting at each dot. Dots define a valid foreground. Mask obtained with Signal to Noise Ratio screening type. Bottom: Final pseudo-color feature image (9x24 px2) represents sample mean values extracted at each grid cell from red and green channels using SNR mask image. Color in a RGB space is assigned to each cluster/pixel.
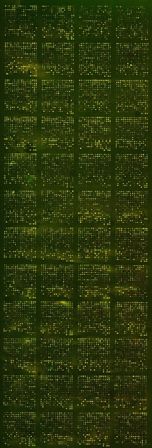
DNA microarrays are typically composed of thousands of DNA sequences, called probes, fixed to a glass or silicon substrate. The DNA sequences can be long (500-1500bp) cDNA sequences or shorter (25-70 mer) oligonucleotide sequences. Oligonucleotide sequences can be presynthesized and deposited with a pin or piezoelectric spray or synthesized in situ by photolithographic or ink-jet technologies.
Relative quantitative detection of gene expression or gene copy number can be carried out between two samples on one array or by single samples comparing multiple arrays.
Double-fluorescent technique uses samples from two sources that are labeled with different fluorescent molecules (Cy3 and Cy5, or Alexa 555 and Alexa 647) and hybridized together on the same array.
The cDNA technology is a complex electrical-optical-chemical process that spans:
- cDNA slide fabrication
- mRNA preparation,
- fluorescence dye labeling,
- gene hybridization,
- robotic spotting,
- green and red fluorophores excitation by lasers,
- imaging using optics,
- slide scanning,
- analog to digital conversion using either charge-coupled devices (CCD) or photomultiplier tubes (PMT), and
- image storage and archiving.
Microarray image technologies: Affymetrix GeneChip chips are produced using photolithography and solid-phase chemistry to produce arrays containing hundreds of thousands of oligonucleotide probes packed at extremely high densities. From an image processing viewpoint, the Affymetrix chips are easier to process since there is no background and the spot shape is rectangular. However, cDNA arrays are appropriate for detecting long DNA sequences while oligonucleotide arrays are designed for detecting only a short DNA sequence. Furthermore, the Affymetrix technology has been much more expensive than the technology with coated glass slides.
Single-, double- or multi-fluorescent cDNA microarrays use variable substrates from coated glass slides or nylon membrane to
2D gel materials.
Images can also be obtained by other labeling schemes, for example, with or without radio-isotopic labels lead to images with
bright background and dark spots.
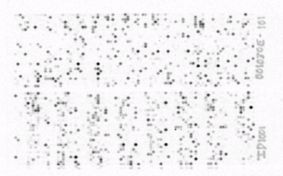
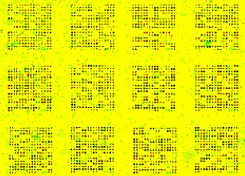
Examples of Microarray with radioactive dye (left) and with double fluorescent dye (right).
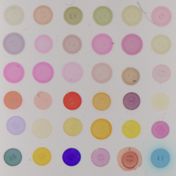
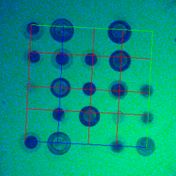
More examples of microarrays used for chemical analysis and detection of odor (left) and disease specific arrays on silicon substrate (middle and right - already with grid overlay).
Samples on this page come from the Keck Center, University of Illinois at Urbana-Champaign, Veterinary medicine college, UIUC, the University of Illinois at Chicago and from the public sources.
In this project we have addressed problems associated with the Microarray image analysis. We proposed an automated method which should reliably identify all spots and patterns within single or multiple arrays based on detection of a grid geometry, foreground and background qualities and a spot morphology. The tools have been developed for all steps and they have been tested on different types of microarrays. The tools are part of the I2K application environment which is currently managed by the Automated Learning Group at NCSA.
This work was published in two book chapters, three peer-reviwed journales and at the conferences.


